
It’s the Monday morning gut-punch every SEO has felt. You log in to Google Search Console, pull up the Performance report, and see a cliff. Impressions, clicks, or both have fallen off a table. The client’s phone call is inevitable. Your boss is already typing in Slack. Panic is the natural first response. It’s also the absolute worst one.
A Google Search Console data anomaly is any unexpected, sharp fluctuation in reported metrics (impressions, clicks, CTR, position) that doesn't immediately correspond to a known site change or a confirmed Google algorithm update. These can be scary-looking dips or confusing spikes, but they are often just artifacts of Google's own data collection and reporting systems, not a reflection of a real-world ranking catastrophe. Understanding the difference is what separates seasoned pros from reactive amateurs.
First, Take a Breath. Don’t Report Panic Numbers to Clients.
I’ve seen more agency-client relationships damaged by premature reporting of GSC weirdness than by actual ranking drops. The moment you forward a screenshot of that terrifying downward trend with a “we’re looking into this!” subject line, you’ve lost control. You’ve ignited a fire drill based on what might be a ghost.
Your first job is not to report the number. It's to validate the number. Clients pay you for analysis, not for forwarding them Google’s UI. Before a single email is sent, your internal team needs to treat the anomaly as a hypothesis, not a fact. The hypothesis is: “GSC is reporting a massive drop.” Now, your job is to try and disprove it with other evidence.
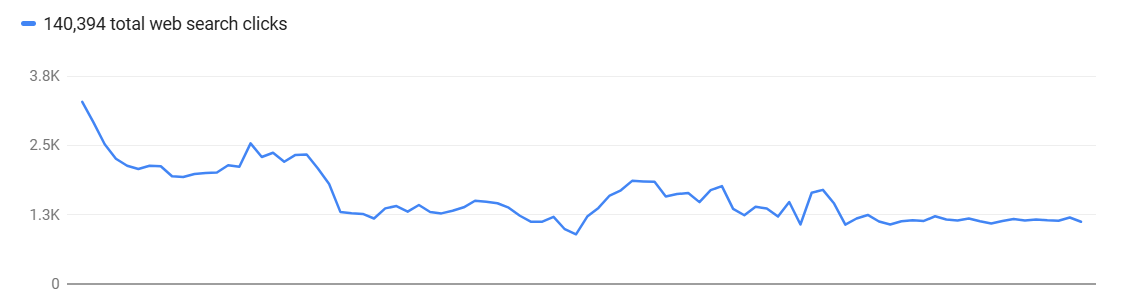
Most of the time, these things are not what they seem. I’d say less than 20% of the time a scary GSC chart reflects a true, site-wide ranking collapse that requires an immediate, all-hands-on-deck response.
The Investigation: Verify with Technical Evidence
This is where you earn your keep. Raw GSC data is a lead, not a conclusion. Your task is to triangulate that data with evidence from the ground truth: your own website and Google’s actual index. Don’t ask “Why did our traffic drop?” Ask “Did our traffic actually drop?”
Step 1: Check Google’s Own Anomaly Reports
Before you even think about your own site, check if Google has already admitted to a problem. They maintain a Data anomalies in Search Console page that lists known reporting issues. It’s not always updated in real-time, but it’s your first stop. For example, a logging error caused GSC to over-report impressions from May 2025 until a fix rolled out in April 2026. As Search Engine Land reported, this fix could cause a sudden drop in reported impressions that looks alarming but is actually just a correction. If your issue is on that list, your investigation is likely over. You can report to the client with a clear explanation and a link to the source.
Step 2: Cross-Reference with Other Analytics
If GSC shows a 40% drop in clicks, does Google Analytics (or your analytics platform of choice) show a corresponding 40% drop in organic sessions? They won’t match 1:1, but they should show a similar trend. If GSC is in a nosedive and GA is holding steady, you’re almost certainly looking at a reporting glitch within GSC, not a real traffic loss.
Step 3: Check Indexing and Crawl Stats
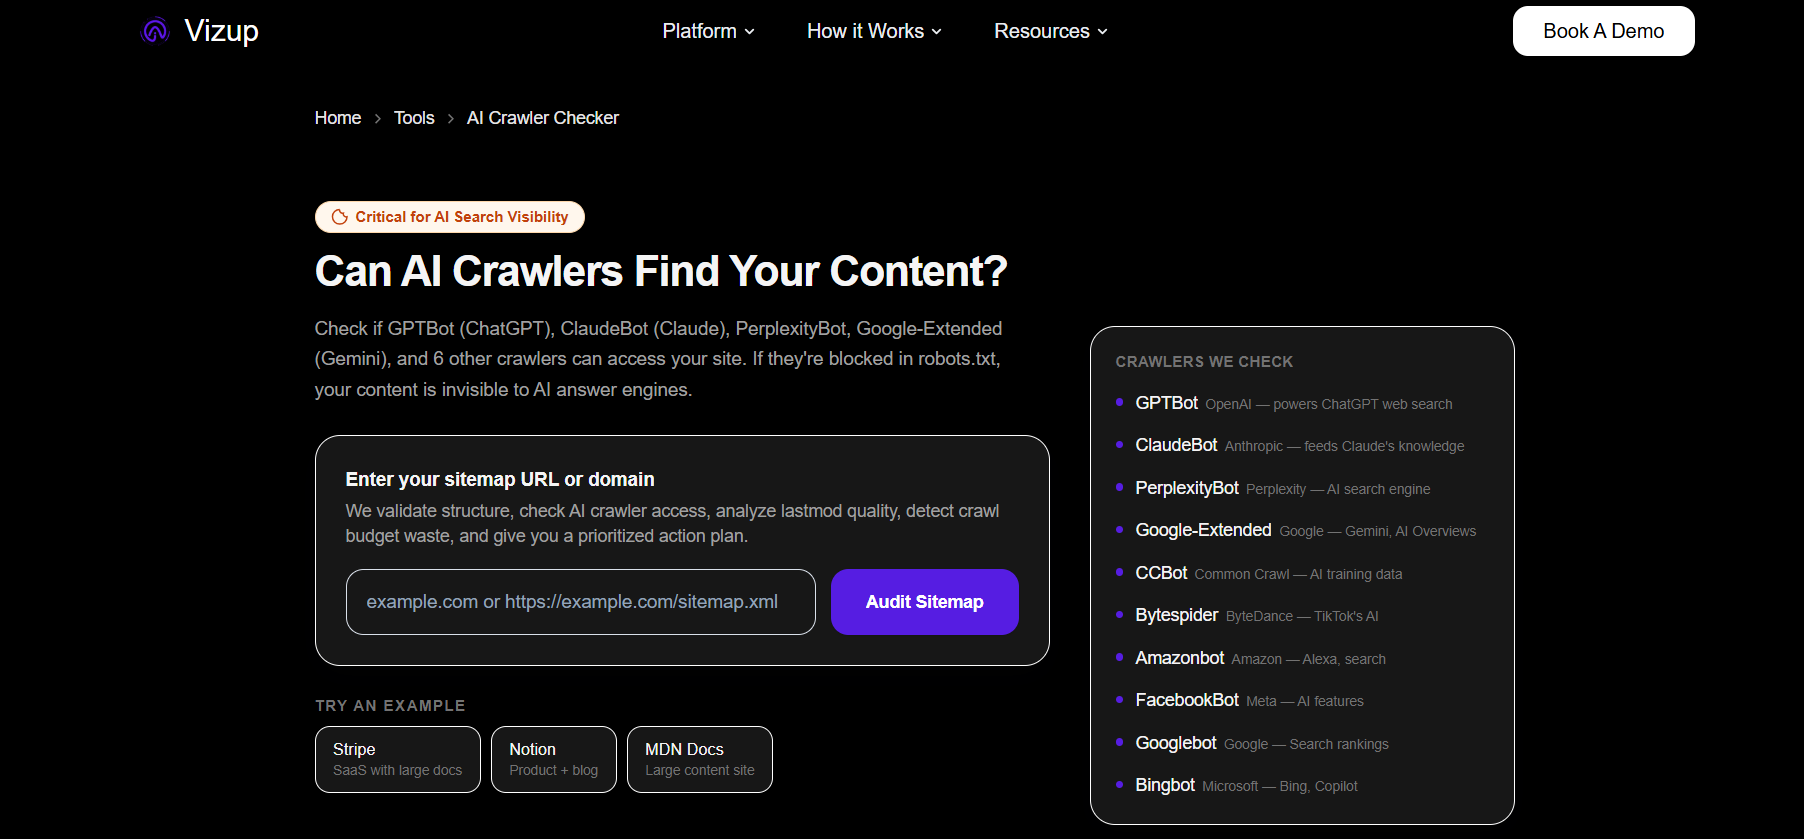
This is the most critical step. A real traffic drop is often caused by pages falling out of the index. Use the Page Indexing report in GSC to look for a sudden spike in “Crawled - currently not indexed” or “Not Found (404)”. If those numbers are stable, your pages are likely still in the index. But GSC can be slow. For a faster, more comprehensive view, you need to be proactive. This is where a tool like AI Crawl Checker by Vizup becomes essential. Instead of sampling a few URLs with the URL Inspection Tool, you can verify your most important pages in bulk. Checking your indexing status across thousands of URLs gives you a definitive answer in minutes. If your key pages are still indexed, the problem isn't a catastrophic de-indexing event.
Is It a Reporting Anomaly or a Real SEO Problem?
After your initial investigation, you’ll fall into one of two buckets. It’s crucial to know which one you’re in.
Signs of a Reporting Anomaly:
- The drop is isolated to one metric (e.g., only impressions) while others are stable.
- Other analytics platforms (like GA4) do not show a corresponding drop in organic traffic.
- Your bulk index checks show that key pages are still indexed.
- Your rank tracking tools show stable positions for your main keywords.
- The drop corresponds perfectly with a date on Google’s official data anomalies page.
Signs of a Real Crawl/Index/Ranking Issue:
- Both GSC and your web analytics show a correlated drop in traffic.
- GSC’s Page Indexing report shows a large, sudden increase in non-indexed pages.
- Your rank tracker shows widespread drops across your primary keyword set.
- The drop coincides with a major site change you deployed (e.g., a migration, redesign, or major change to robots.txt).
- The timing aligns with one of the recent Google core updates or a spam update.
Most of the advice online conflates these two scenarios. The response to a reporting anomaly is to monitor, document, and reassure. The response to a real SEO issue is a full-scale audit and recovery plan. Acting on one as if it’s the other is a massive waste of resources.
Build a Standard Response Playbook
You shouldn’t be inventing this process every time a GSC chart looks funny. Your team needs a documented, step-by-step playbook. This standardizes your response, prevents panic, and ensures nothing gets missed. It also demonstrates professionalism to clients; you’re not scrambling, you’re executing a known procedure.
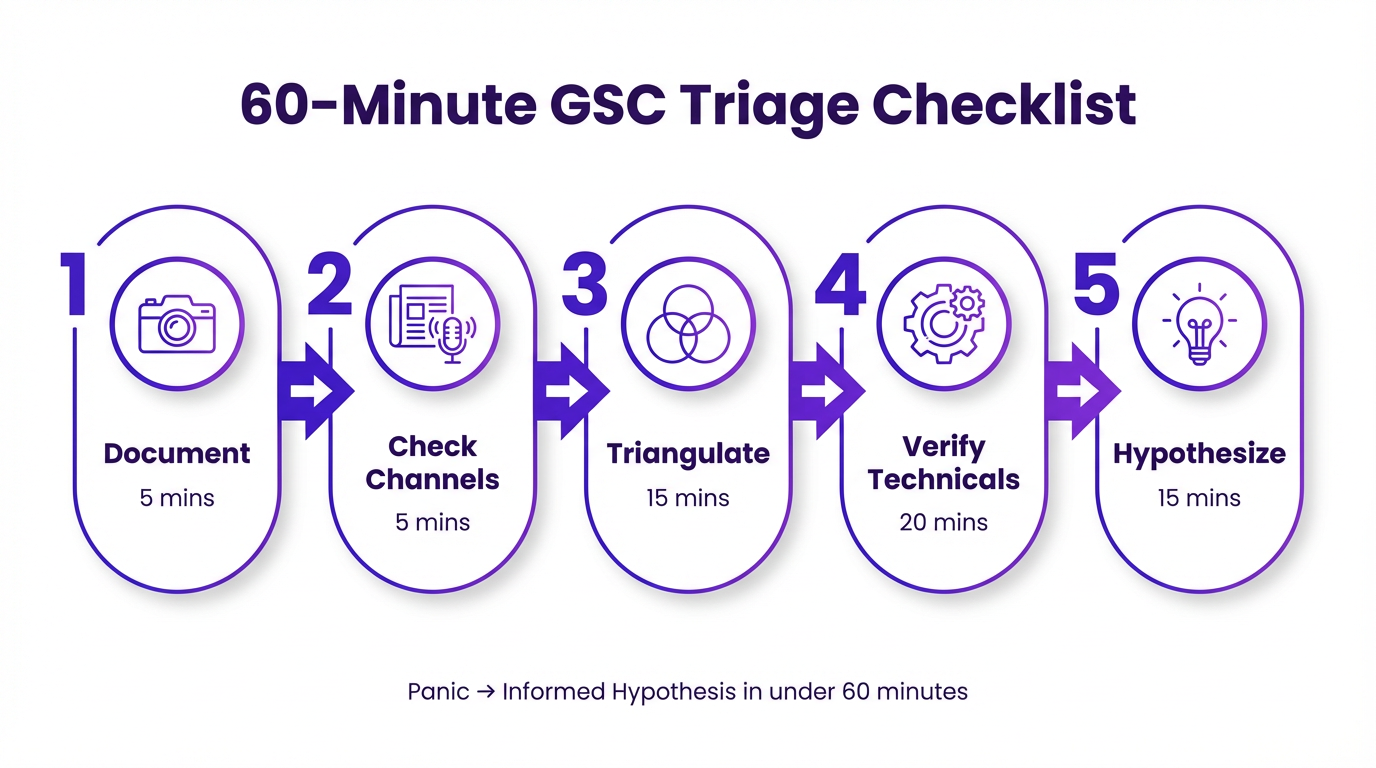
Your 60-Minute Triage Checklist
This should be a living document, but here’s a solid starting point. The goal is to go from “panic” to “informed hypothesis” in under an hour.
- 1. (5 mins) Document the Anomaly: Screenshot the GSC report. Note the date range, metrics affected, and any filters applied. Is it sitewide or affecting a specific country, device, or page type?
- 2. (5 mins) Check Official Channels: Look at the Google Search Central data anomalies page and the Search Engine Land news feed for any breaking reports of widespread issues.
- 3. (15 mins) Triangulate with Analytics & Rank Tracking: Open your web analytics and your primary rank tracking tool. Compare organic traffic trends and keyword visibility for the same period. Do the stories match?
- 4. (20 mins) Verify Technical Health: This is the core of it. Run a bulk index check on your top 1,000 traffic-driving URLs. Spot-check your robots.txt and sitemaps. Look at the Crawl Stats report in GSC for any unusual host status errors or a drop in crawl frequency.
- 5. (15 mins) Synthesize and Form a Hypothesis: Based on the evidence, what is the most likely cause? Write it down in a single sentence. Examples: “GSC is showing an impression drop that isn’t reflected in GA or rankings, likely a reporting glitch.” OR “GSC and GA both show a 30% drop coinciding with a spike in 404s in the Indexing report, likely due to the recent product database update.”
Only after completing this triage do you communicate with the client or wider team. Now, your message isn’t “The sky is falling!” It’s “We’ve observed an anomaly in GSC’s reporting. Our initial investigation suggests X, and our next steps are Y and Z.” It’s a world of difference.
How Vizup Provides the Toolkit for Your Playbook
Having a playbook is one thing. Having the tools to execute it efficiently is another. This is where a unified platform becomes a force multiplier. Instead of jumping between five different tabs and trying to stitch data together, you can run your diagnostics from a single source of truth. The official Google Search Console is the starting point, but it's not a complete diagnostic toolkit.
Vizup is built for this exact scenario. It’s the toolkit behind the playbook.
Vizup isn't just another dashboard. It's the diagnostic layer that sits on top of Google Search Console, turning vague data drops into specific action items. Instead of guessing, you get direct answers.
First, you get immediate context. Our rank tracking lets you see if a GSC impression drop matches an actual slide in SERP visibility for your money keywords. GSC's averages can hide a fatal drop for a specific high-value term. Vizup puts that front and center.
Then there's the technical side. Vizup's site auditing and monitoring tools catch the root causes that GSC only hints at. You'll get alerts on new redirect chains, a spike in 404 errors, or critical pages suddenly becoming non-indexable. This moves you from seeing a problem to fixing it.
It connects the dots. Maybe the issue isn't a technical error but a content problem highlighted by a recent algorithm update, like Google's latest spam update. By integrating technical health, keyword performance, and content analytics, you can actually see the full picture and stop wasting time chasing phantom issues.
The goal is to shrink the time between detection and diagnosis. A solid playbook powered by an efficient toolset like Vizup can turn a two-day fire drill into a one-hour diagnostic sprint. This frees up your team to focus on what actually matters: the long-term strategy to improve your search ranking.
Key Takeaways
When the Google Search Console data looks bad, resist the urge to react. Your value as an SEO professional is in your methodical, evidence-based response.
- Don't Panic-Report: Never forward a scary GSC chart to a client without context. Your first job is to investigate, not to amplify the alarm.
- Triangulate Your Data: GSC is just one data point. Cross-reference its numbers with your web analytics, rank tracking, and-most importantly-bulk index checks to see if the problem is real.
- Distinguish the Cause: Systematically determine if you're facing a benign reporting anomaly or a genuine technical SEO issue. The response for each is completely different.
- Build a Playbook: Document a standard operating procedure for your team. A checklist for the first 60 minutes of an incident ensures a calm, thorough, and professional response every time.
- Use the Right Toolkit: An integrated platform like Vizup streamlines your playbook, providing the rapid index checking and monitoring needed to diagnose issues quickly and accurately.
Frequently Asked Questions
How often do data anomalies happen in Google Search Console?
Minor fluctuations happen daily, but significant, noticeable anomalies caused by Google's internal reporting systems occur a few times a year. It's common enough that you absolutely need a process for handling them.
What's the difference between GSC data and Google Analytics data?
GSC measures search performance before the click (impressions, clicks, CTR, position in Google Search). Google Analytics measures what happens after the click (sessions, bounce rate, conversions on your site). They measure different things and will never match perfectly, but their organic traffic trends should be directionally similar.
Can a manual action cause a sudden drop in GSC?
Yes, absolutely. If you suspect a real performance drop, one of your first checks should be the 'Manual actions' section in GSC. A penalty will cause a sudden and severe drop in data and will be explicitly reported there.
Why are clicks in the GSC performance report higher than the sum of clicks in the query table below it?
This is a common point of confusion. Google anonymizes rare or personal queries to protect user privacy. These clicks are included in the chart totals at the top but are omitted from the query table. This discrepancy is normal and not a sign of an error.
I've confirmed the drop is real. What's the first thing I should do?
If your triage confirms a real issue, the first step is to isolate the scope. Is it sitewide, or limited to a specific section (e.g., /blog/, /products/)? Is it on mobile or desktop? Identifying the scope narrows your search for the root cause, which is often a technical change like a bad robots.txt update or indexing issues. Check out the Vizup blog for deeper dives on recovery.