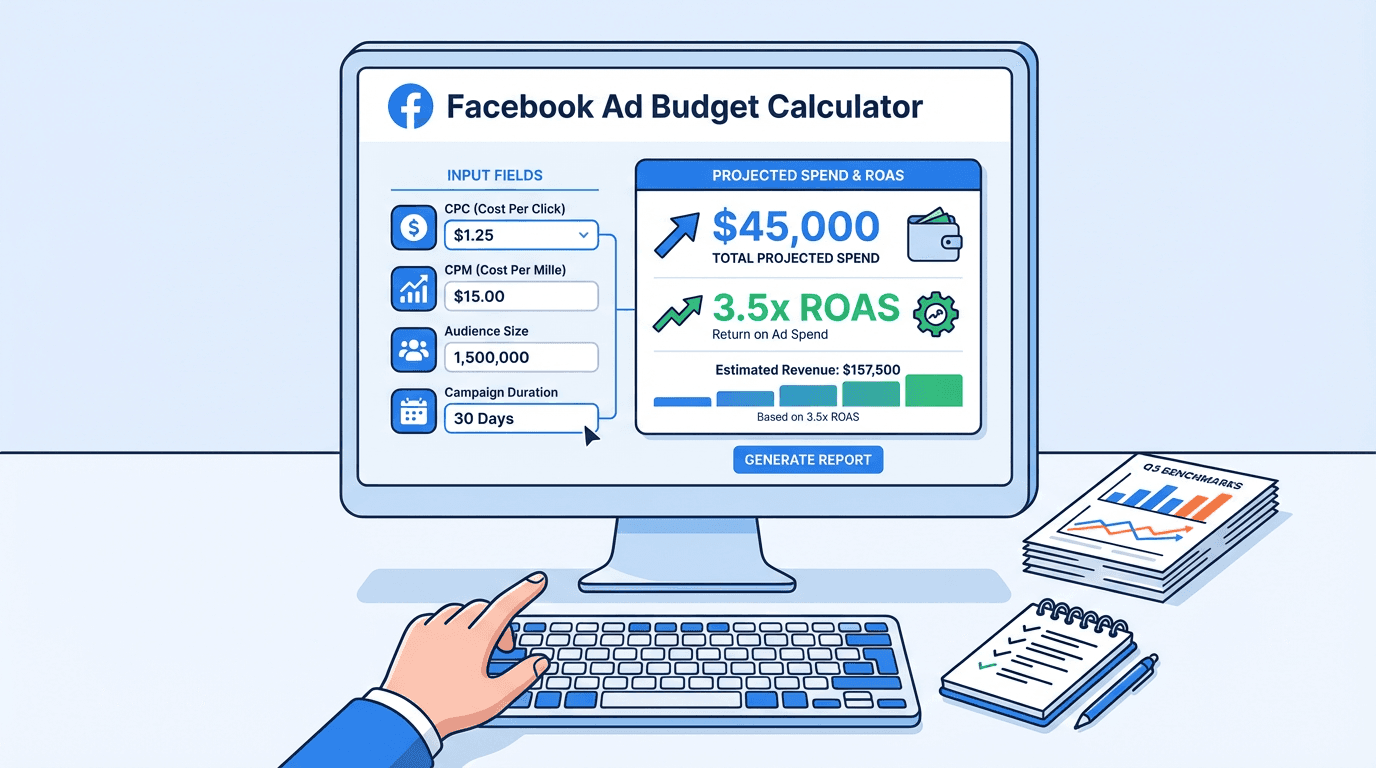
A Facebook ad cost calculator is a planning tool that takes your target audience size, expected click-through rate, CPC or CPM, and campaign duration, then produces a projected budget and return forecast. Its purpose is straightforward: give you a structured starting point before a single dollar leaves your account.
The problem? Most marketers treat the output like a contractor's quote. They plug in numbers, see a projected ROAS, and build a business case around it. But a Facebook ad calculator is a model built on assumptions, not a binding estimate from Meta. This article pulls back the curtain on the math, the inputs that actually move the needle, and the blind spots every ad budget calculator quietly ignores.
Why a Facebook Ad Budget Calculator Matters More Than You Think
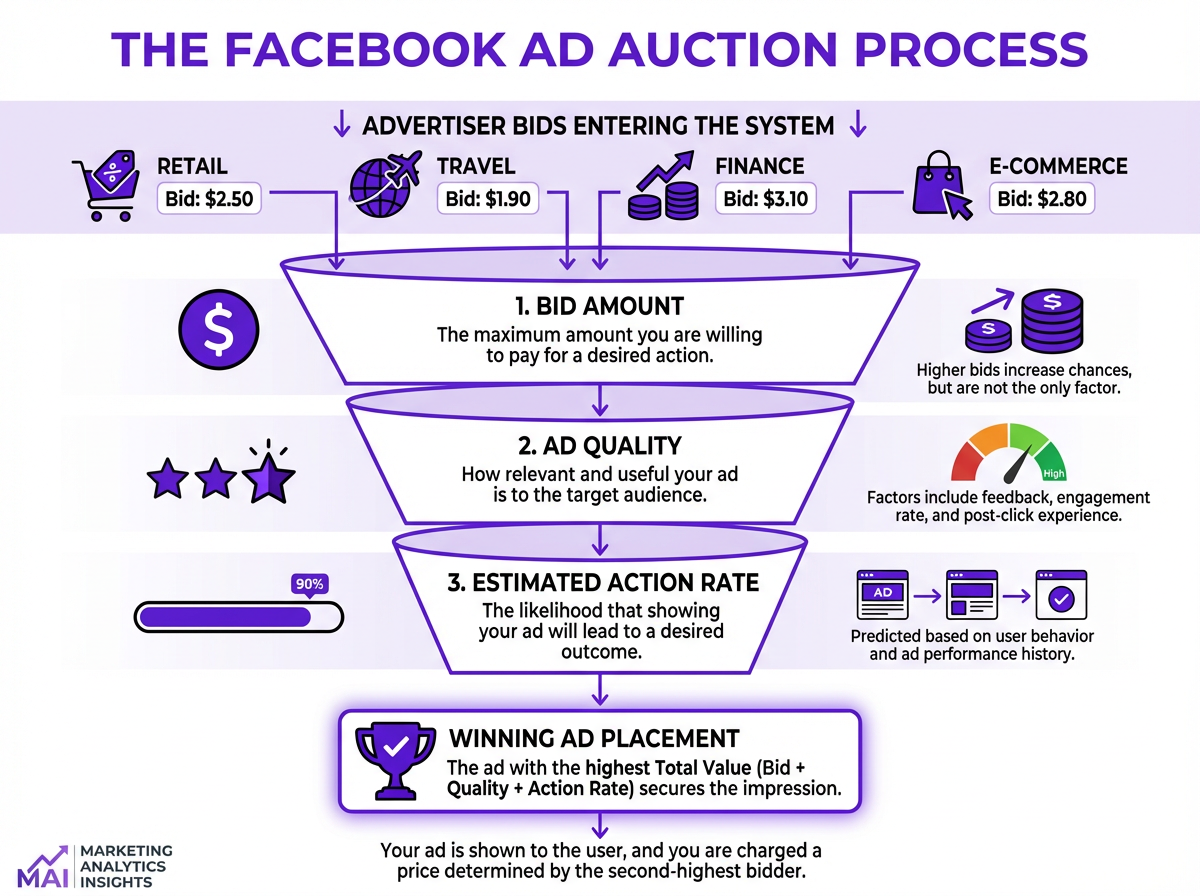
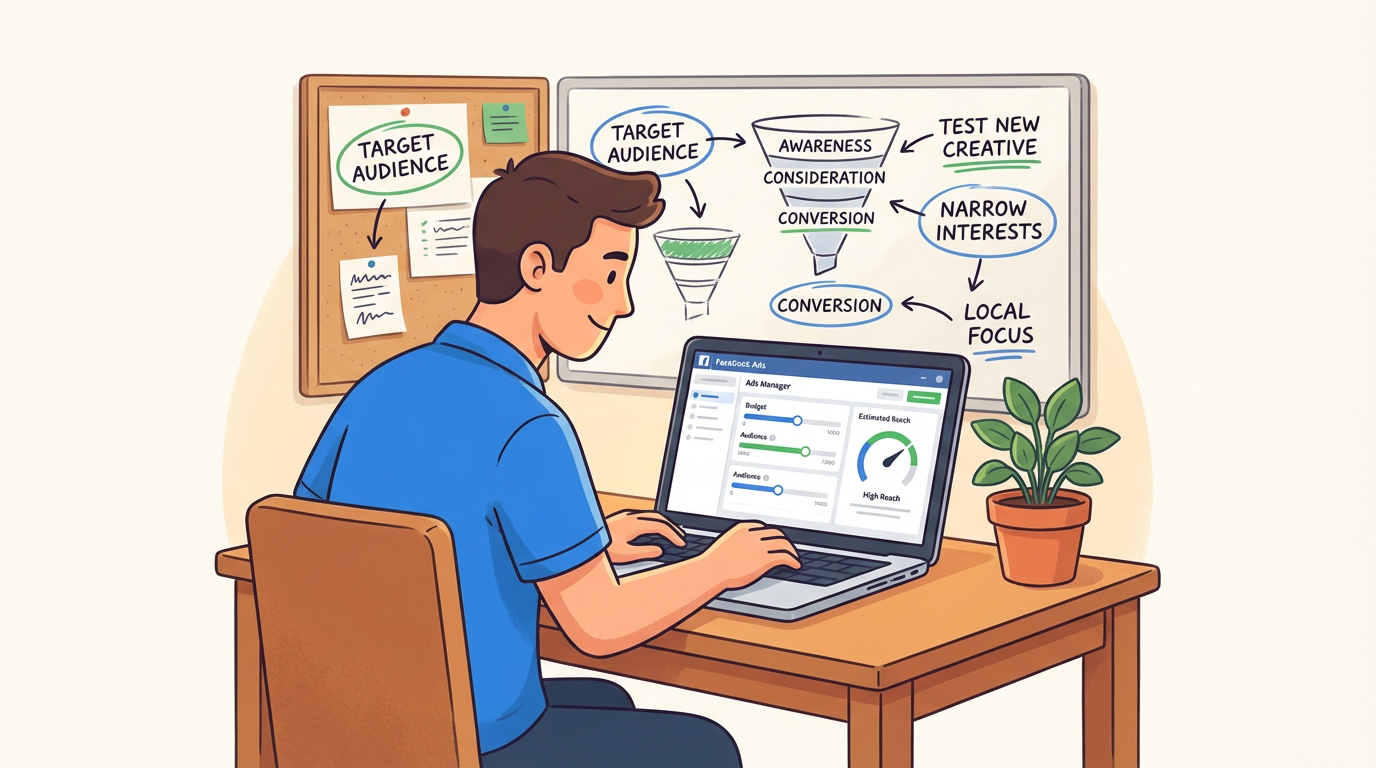
Facebook's ad pricing is not a menu. It's an auction outcome. According to Meta's developer documentation on bidding, what you pay is determined by three factors: your bid, your ad quality, and the estimated probability that a user will take the action you're optimizing for. Two advertisers targeting the same audience can pay dramatically different CPMs based on creative quality alone. A calculator can't replicate that complexity, but it forces you to articulate your assumptions before you spend. That discipline is the whole point.
Without pre-campaign estimation, businesses routinely burn through budget in the first two weeks before they have enough data to optimize. The real value isn't the final number the calculator produces. It's the discipline of committing to a conversion rate assumption, an average order value, and a target CPA before anything goes live. Those inputs become your benchmark for evaluating real performance against your plan. Vizup's AI-powered organic marketing platform can help establish these benchmarks by analyzing your existing audience engagement patterns and content performance.
The Inputs: What You Feed the Machine
Every Facebook ad estimator is only as good as its inputs. That's not a cliché; it's the central risk of using these tools. Understanding what each input actually represents changes how you interpret the output and whether your projections hold up once the campaign goes live.
Facebook CPC and CPM: The Two Pricing Lenses
CPC (cost per click) and CPM (cost per mille, or per thousand impressions) are not interchangeable metrics. CPC tells you what you pay when someone clicks your ad. CPM tells you what you pay for exposure, regardless of whether anyone clicks. A calculator asking for CPC is modeling a traffic or conversion campaign. One asking for CPM is modeling awareness. Plug the wrong metric into the wrong model and every downstream projection is skewed before you've started.
According to 2025-2026 benchmark data, the average CPC for a traffic campaign sits around $0.70, while leads campaigns average $1.92. Industry matters enormously: finance verticals regularly see CPCs above $3.70, while apparel can come in around $0.45. Average CPM across industries typically falls between $7 and $15, though Q4 competition pushes that ceiling significantly higher.
Budget, Duration, and Audience Size
Daily and lifetime budget inputs produce different outputs because they model different pacing behaviors. A $1,000 lifetime budget over 30 days gives Facebook's algorithm room to spend more on high-opportunity days and pull back on slow ones. A $33/day daily budget is more rigid. Duration also matters for a reason most calculators skip: campaigns under roughly 50 conversions are still in Meta's learning phase, where costs are volatile and performance is unpredictable. A calculator showing a clean 30-day projection assumes your campaign exits the learning phase without incident. Many don't.
Audience size interacts with budget in non-obvious ways. A $5,000 monthly budget aimed at 50,000 people will cause ad fatigue within days. The same budget against 2 million users dilutes your relevance score. Most Facebook ad calculators treat audience size as a reach multiplier, not as a variable that affects frequency, fatigue, and your effective CPC over time. You can use Vizup's audience analytics tools to analyze audience saturation and find the sweet spot for your budget.
Conversion Rate and Average Order Value
These are the inputs most people guess at, and the ones that swing ROI projections the hardest. Here's a quick illustration: on a $1,000 spend with a $1.00 CPC, you get 1,000 clicks. At a 1% conversion rate and a $50 average order value (AOV), that's 10 sales and $500 in revenue. Change the conversion rate to 3% and revenue jumps to $1,500 from the same spend. A single percentage point of difference in your conversion rate estimate produces a 3x difference in projected return. If that estimate is wrong, your entire ROI projection is fiction.
The Outputs: Reading What a Facebook Ad Estimator Actually Produces
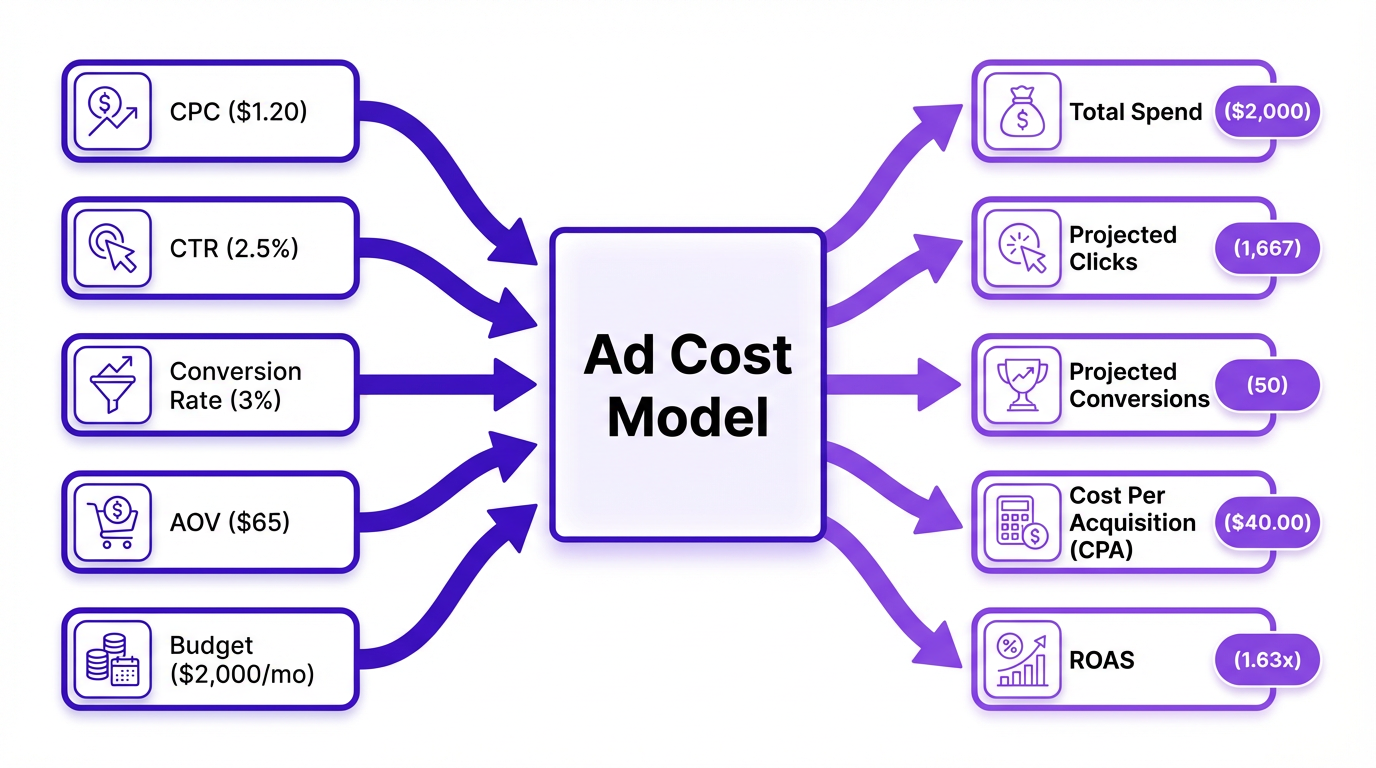
Most calculators produce five key outputs: estimated total spend, projected clicks, projected conversions, cost per acquisition (CPA), and a ROAS figure. Here's a worked example. A DTC skincare brand runs a $2,000/month campaign with a $1.20 CPC and a 2.5% CTR. That CTR on a CPM basis yields roughly 1,667 clicks per month. At a 3% landing page conversion rate, that's 50 conversions. With a $65 AOV, total revenue is $3,250. ROAS = $3,250 / $2,000 = 1.63x.
That 1.63x looks thin, and it is. But here's what the calculator omits: creative production costs, agency or tool subscription fees, and the team hours spent managing the campaign. ROAS is a ratio of ad spend to revenue. ROI is a ratio of total investment to profit. Conflating the two is one of the most common mistakes in paid media reporting. To understand what your ad metrics really mean beyond the surface numbers, it's worth examining how platform-reported figures can diverge from actual business outcomes.
Facebook Ad Cost Benchmarks by Industry (2025-2026 Data)
The table below aggregates recent benchmark data from multiple industry reports. Use these as calibration points, not targets. A finance brand with exceptional creative can outperform its benchmark; a retail brand with a slow-loading landing page will underperform it. Your actual results depend on creative quality, audience targeting precision, and landing page experience. For deeper insights into your specific vertical, explore Vizup's marketing insights blog.
| Industry | Avg CPC | Avg CPM | Avg CTR | Avg Conv. Rate | Typical ROAS Range |
|---|---|---|---|---|---|
| Ecommerce | $0.70-$1.20 | $9-$14 | 1.5-2.5% | 2-4% | 1.5x-4x |
| SaaS / Software | $1.50-$3.00 | $7-$14 | 0.8-1.5% | 1-2.5% | 1.2x-3x |
| Finance | $3.00-$4.50 | $10-$18 | 0.6-1.2% | 1-2% | 1.5x-3.5x |
| Education | $1.00-$2.50 | $7-$12 | 1.0-2.0% | 2-5% | 2x-5x |
| Healthcare | $1.50-$3.50 | $8-$15 | 0.8-1.5% | 1.5-3% | 1.5x-3x |
| Real Estate | $1.80-$3.20 | $5-$16 | 0.9-1.8% | 1-2.5% | 1.5x-4x |
| Retail / Apparel | $0.40-$0.90 | $5-$9 | 1.8-3.0% | 2-5% | 2x-5x |
| Entertainment | $0.60-$1.50 | $5-$11 | 1.5-2.8% | 1.5-3.5% | 1.5x-3.5x |
| Source: Data aggregated from multiple 2025-2026 industry reports. Ranges reflect variation across campaign objectives (e.g., traffic vs. leads) and audience quality. Individual account performance will vary. |
What a Facebook Ad Cost Calculator Is NOT Telling You
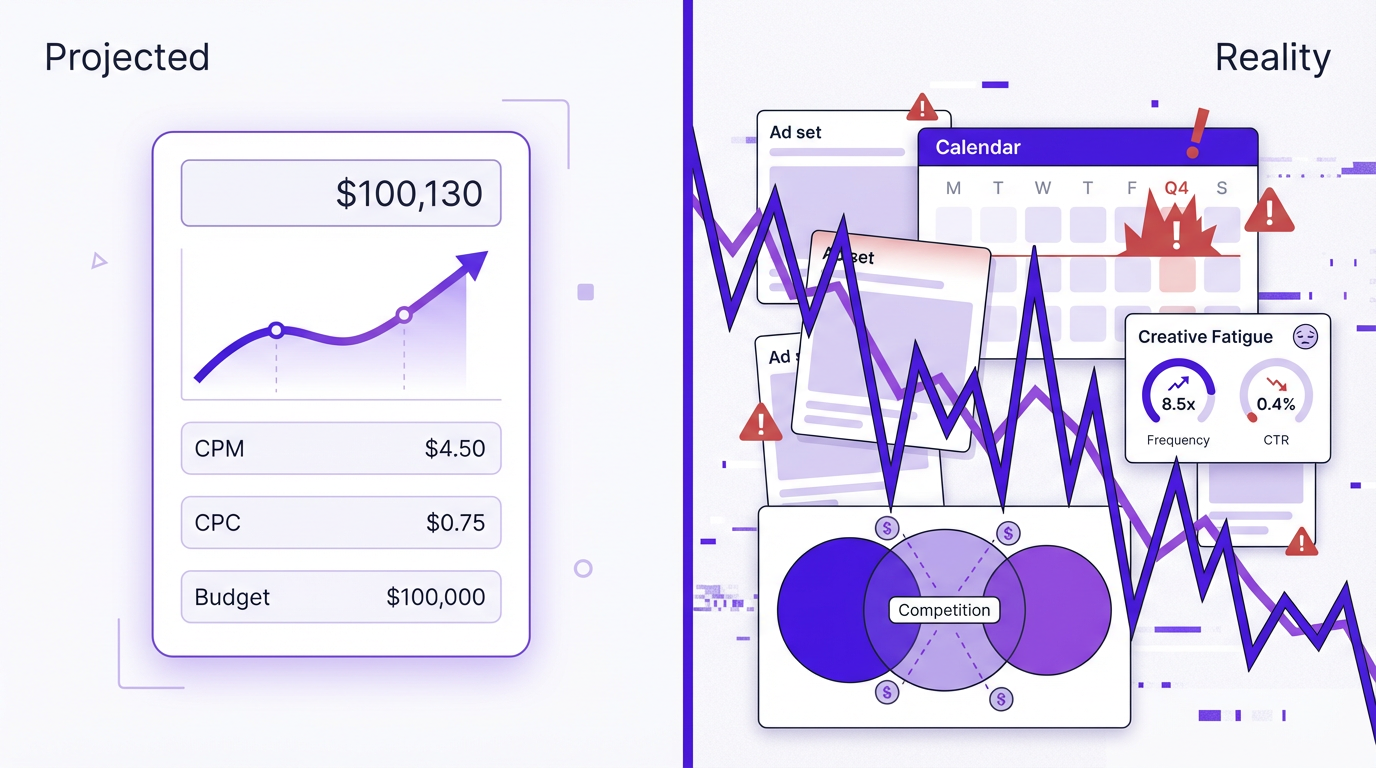
Calculators assume static costs. In practice, Facebook ad costs fluctuate weekly based on auction competition, algorithm updates, and seasonality. Q4 CPMs routinely spike 30-50% as retail advertisers flood the auction. A projection built in September will be materially wrong by November, and no calculator will warn you about that.
Beyond seasonality, there are structural blind spots that no Facebook ad budget calculator can model:
Hidden variables that calculators ignore:
- Creative fatigue: as frequency rises, CTR drops and effective CPC climbs, often within 7-10 days on a narrow audience.
- Audience overlap: running multiple ad sets targeting similar audiences inflates your effective CPM because you're competing against yourself in the same auction.
- Learning phase resets: new campaigns or ad sets with significant edits restart the learning phase, causing cost instability for days.
- Organic lift: brand searches, social shares, and direct traffic generated by your ads never appear in your ROAS column.
- Attribution window differences: a 7-day click window will report more conversions than a 1-day window from the exact same campaign.
3 Misconceptions That Lead Marketers Astray
Misconception 1: "The calculator said I'd get X results, so Facebook owes me X results." A calculator is a model, not a contract. The auction is live and competitive. Your projected CPC is based on historical averages, not a reserved price. If a major competitor increases their budget the week your campaign launches, your costs go up. Period.
Misconception 2: "Lower CPC always means a better campaign." A $0.30 CPC driving unqualified traffic that converts at 0.5% is far less valuable than a $2.00 CPC driving high-intent clicks that convert at 4%. The first scenario produces a higher CPA despite the lower click cost. For performance campaigns, cost per acquisition is the metric that matters, not CPC in isolation.
Misconception 3: "I only need to calculate my ad budget once." Your inputs change as real data comes in. The conversion rate assumption you made before launch will be replaced by actual numbers within two weeks. Recalculate monthly at minimum, and recalibrate against real account performance rather than industry averages.
When to Skip the Calculator Entirely
Spending under $500 per month? The margin of error in any Facebook ad budget calculator is larger than your actual budget. At that scale, you don't have enough data to validate your conversion rate or CPC assumptions. Start with Meta's native Ads Manager reach and frequency estimates, run a small test, and let real data replace your assumptions before building any projection model.
If your business relies on organic reach, community building, or content-driven growth, a Facebook ad estimator is solving the wrong problem. Paid calculators assume paid is the primary channel. If your organic content already drives qualified traffic, over-investing in paid before you've maximized that return is a common and expensive mistake. According to Meta's own data, average ad reach varies significantly, but that reach only matters if the underlying offer and landing experience are already proven. You can build this foundation using Vizup's content optimization tools.
Pairing Paid Estimates with Organic Strategy
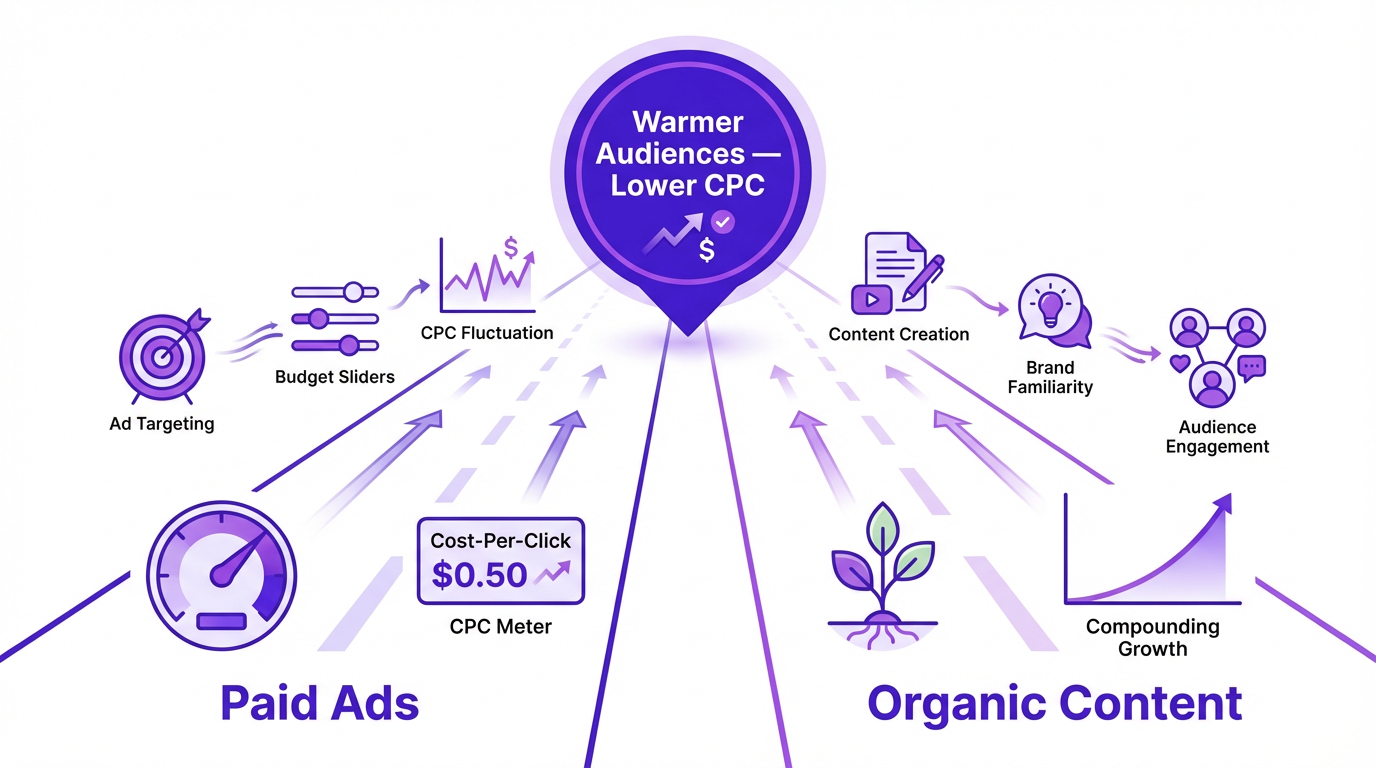
The sharpest performance marketers use calculator projections to identify where paid costs are prohibitively high, then redirect energy toward organic content that compounds over time. When your Facebook ads ROI projections look thin at a $2.50+ CPC, that's a signal worth taking seriously. It often means the audience isn't warm enough, the offer isn't differentiated enough, or the landing page isn't converting at the rate the calculator assumed.
Vizup is an AI-powered organic marketing platform that helps brands build sustainable traffic without depending on escalating ad costs. The practical play: use organic content to build brand familiarity, then retarget that warmer audience with paid campaigns. Audiences who already recognize your brand typically produce CPCs 30-60% lower than cold prospecting campaigns, which makes your calculator projections far more achievable. This strategy helps you enhance your digital presence and build a more resilient marketing mix.
Key Takeaways
What a Facebook ad cost calculator is really telling you:
- A Facebook ad cost calculator produces a projection based on your inputs, not a quote from Facebook. The auction is live and your actual costs will differ.
- CPC and CPM measure different things. Using the wrong metric as your input models the wrong campaign type entirely.
- Conversion rate and AOV swing ROI projections more than any other input. Estimate conservatively, then update with real data within two to four weeks.
- Industry benchmarks are averages. Creative quality, audience fit, and landing page experience determine where your account actually lands.
- Calculators can't model creative fatigue, the learning phase, audience overlap, or Q4 cost spikes. Build a buffer into every projection.
- Recalculate monthly. Initial inputs are assumptions that live data should replace as quickly as possible.
- When paid projections look thin, strengthen your organic foundation with tools like Vizup so retargeting campaigns can perform at lower CPCs.
Frequently Asked Questions
How accurate is a Facebook ad cost calculator?
A Facebook ad cost calculator is directionally useful for initial planning, but its outputs are not a precise forecast. The accuracy of any calculator depends entirely on the quality of your inputs. Using industry-average CPC and CPM benchmarks can result in projections that are off by 50% or more for your specific account, audience, and creative. Treat the outputs as a general planning range. Real accuracy is only achieved after two to four weeks of live campaign data, which you can then use to recalibrate your initial assumptions.
What is a good CPC for Facebook ads in 2026?
A "good" CPC on Facebook depends heavily on your industry and campaign objective. For ecommerce, a CPC between $0.70 and $1.20 is often considered typical. Verticals like finance and legal services regularly see CPCs over $3.00. More important than CPC alone is your cost per acquisition, a higher CPC that drives qualified buyers frequently outperforms a lower CPC that only generates unqualified clicks.
How much should I budget for Facebook ads as a small business?
A starting budget of $500 to $1,500 per month provides enough data to exit Facebook's learning phase and enable meaningful optimization decisions. Below the $500 per month threshold, the margin of error in any Facebook ad budget calculator often exceeds your actual spend, making projections unreliable. Start with one or two focused ad sets, gather real conversion data, and only scale the budget after you have validated your cost per acquisition against your unit economics.
Can a Facebook ad estimator predict my exact return on ad spend?
No, a Facebook ad estimator cannot predict your exact return on ad spend (ROAS). While it can project ROAS based on your input assumptions, it cannot account for variables like creative fatigue, shifts in auction competition, seasonality, or the initial learning phase. Projections from calculators are best used as a pre-campaign benchmark to evaluate actual performance against. True ROI also requires factoring in costs for creative development, analytics and reporting tools like Vizup, and team time, none of which are included in standard calculators.
How often should I recalculate my Facebook ad budget?
You should recalculate your Facebook ad budget at a minimum of monthly, and immediately following any significant campaign change like introducing a new audience, creative, or objective. Your initial inputs are assumptions. After two to four weeks of live data, you will have real CPC, CTR, and conversion rate figures that should replace your initial estimates. Quarterly recalibration against updated benchmarks keeps your projections grounded in current auction conditions rather than outdated averages.