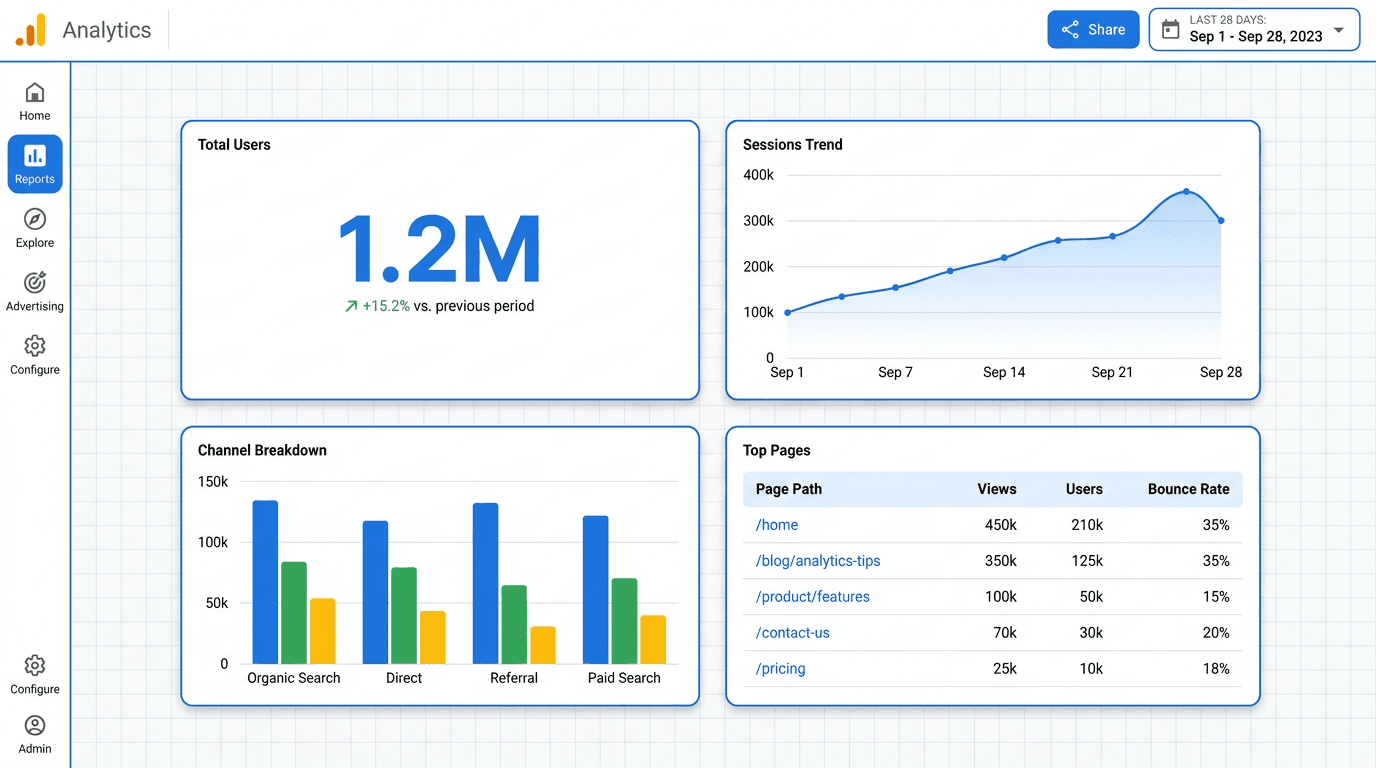
GA4 custom dashboards, launched September 9, 2026, address a gap analytics teams have flagged since Universal Analytics retired. Inside GA4, the choice had been stark: rigid standard reports with little room for customization, or Explorations designed for deeper, ad hoc analysis rather than as a persistent stakeholder-facing KPI surface. Explorations support more advanced investigative techniques, but shared Explorations have more limited collaboration behavior than published dashboards. The dashboard builder sits between them: a drag-and-drop canvas in Reports where teams can assemble persistent, interactive views for anyone with property access.
For analytics leads, SEO managers, and marketing ops teams, the appeal is straightforward: share KPI views without setting up another reporting product. A Google Analytics custom dashboard can stay current, follow property permissions, and open in a readable state each morning. The process has five steps:
How to build a GA4 custom dashboard:
- Navigate to Reports, click + Create, then choose Dashboard.
- Create a new dashboard and choose your grid layout.
- Add and configure dashboard cards (scorecards, charts, tables).
- Configure dimensions and charts, then set a default date range.
- Share the dashboard with stakeholders using GA4's native permissions.
Before You Start: What You Actually Need
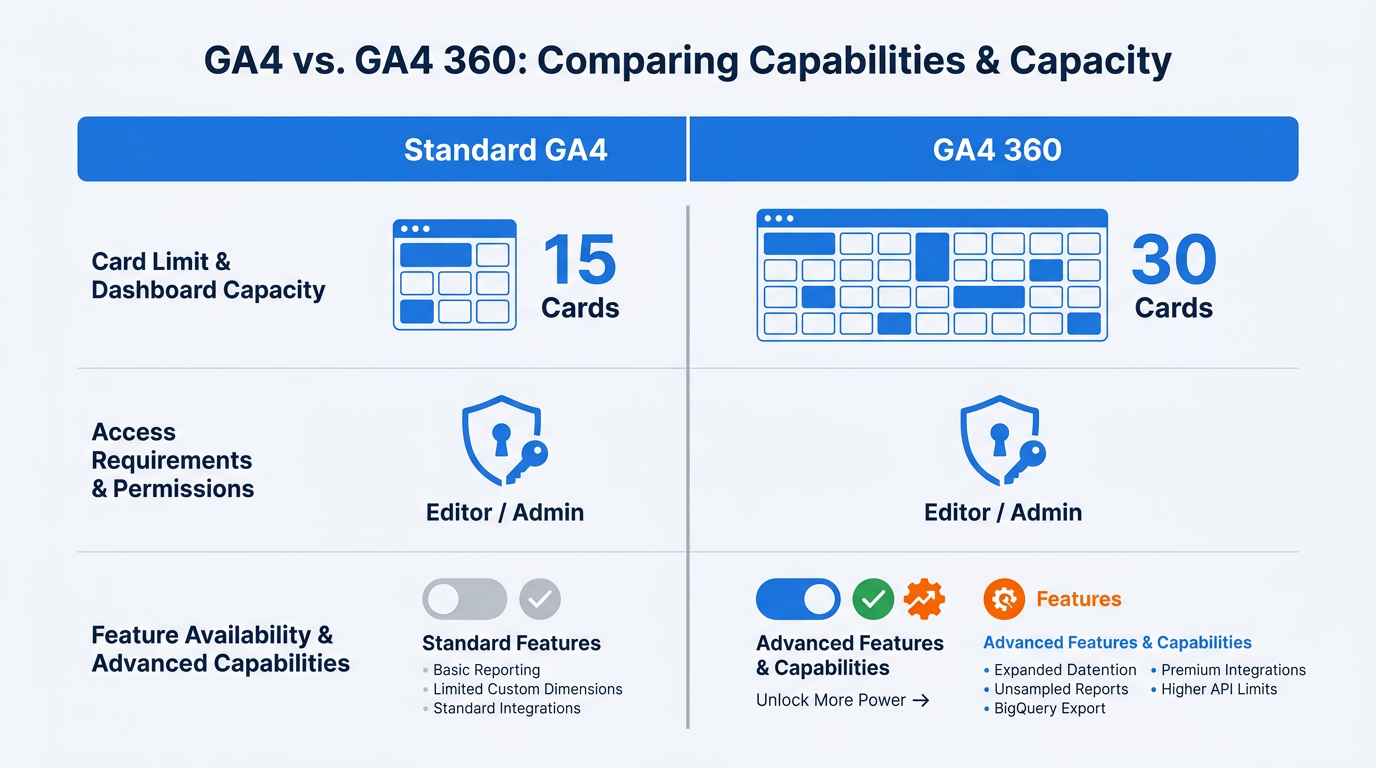
Start with a GA4 property where you have Editor or Administrator permission. Viewers can open published dashboards but cannot create or save them. Check Admin > Property Access Management if you are not sure which role you hold.
Your account tier sets the card ceiling. Standard GA4 properties allow 15 cards per dashboard; GA4 360 raises that to 30, leaving more room for detailed breakouts. You do not need a Looker Studio account. That is the practical case for the native builder as a Looker Studio alternative for GA4: one less tool to provision, authenticate, and maintain.
Step 1: Find the GA4 Dashboard Builder
Open the property and select Reports in the left navigation. Click + Create near the top of the Reports navigation, then choose Dashboard. The dashboard builder is here, not under Explore. That distinction catches analysts because Explorations also support custom views, but their sharing behavior and intended use are different.
The + Create menu includes Dashboard as a report type. Selecting it opens the dashboard grid canvas. Dashboards launched on September 9, 2026. If the option is missing, verify that your GA4 interface is current and that your role is Editor or Administrator. If the option is missing, verify that the GA4 interface is current and your role is Editor or higher.
Step 2: Create a New Dashboard and Choose Your Layout
Select "Create new dashboard" and name it for immediate recognition. "Q3 2026 Marketing Overview" works; "Test Dashboard 4" does not. Once published, everyone with property access sees that dashboard name in Reports navigation, so vague labels quickly become clutter.
Cards snap to a grid and can be rearranged by dragging. Placement shapes how someone reads the page, so put the metrics that matter most - sessions, conversions, revenue - in the upper left. Begin with a blank canvas rather than a template. Template metric sets rarely map cleanly to a team's KPIs, and stripping out prebuilt cards is usually slower than adding the right ones.
Step 3: Add and Configure Dashboard Cards
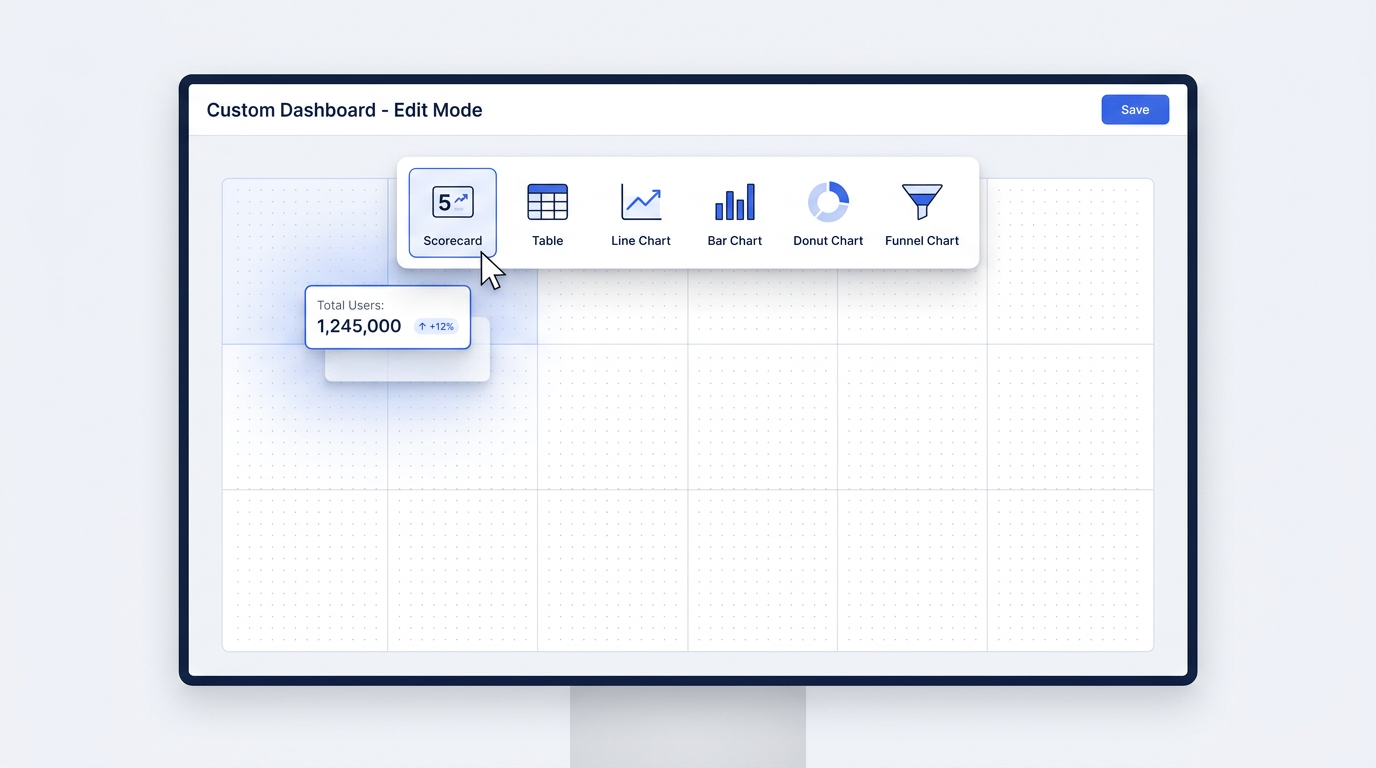
Use the "+" button on the canvas to add a card. There are six visualization types: scorecards, tables, line charts, bar charts, donut charts, and funnel charts. Each card is configured with the dimensions and metrics supported by its visualization type. That might be a line chart for Sessions by Default Channel Group or a Total Revenue scorecard.
In the card configuration panel, choose a metric and add a dimension where it makes sense. Dashboards support report-level date comparisons, and scorecards can display percentage changes based on that comparison. Individual cards cannot each use their own independent comparison. Card limits matter here. Standard properties get 15; GA4 360 gets 30. Map the layout in a spreadsheet or on paper first, rather than discovering halfway through that the channel chart has no remaining slot.
Tip: Tip: Metric availability can vary by report type and dashboard configuration. If a metric you expect to use is missing, check the available metric list in the dashboard builder before finalizing the layout.
The builder does not currently offer segments, independent card-level comparisons, or custom calculated metrics. Use Explorations or Looker Studio when those are required. Dashboards are built for persistent monitoring, not ad-hoc analysis.
Step 4: Apply Filters and Date Ranges
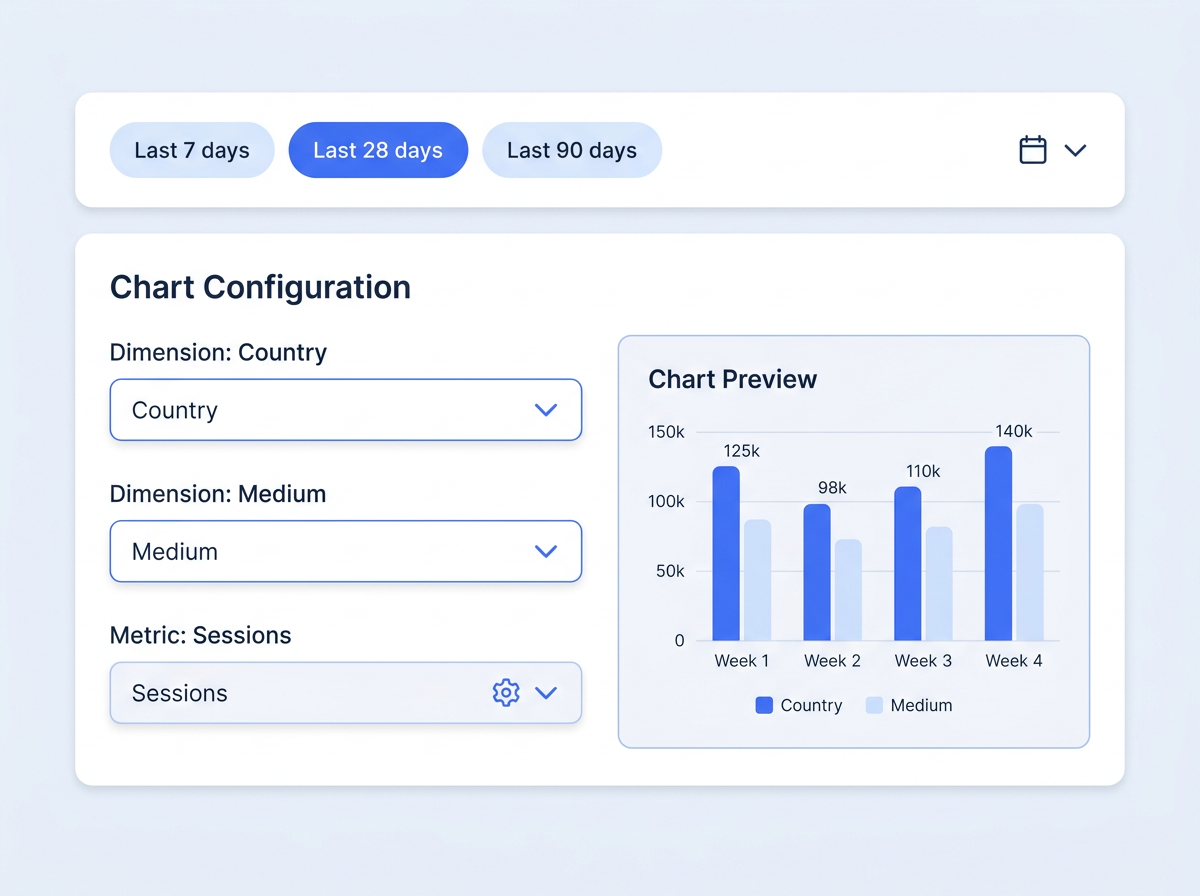
Use dimensions and chart configuration to keep recurring views focused on the audience or channel you need. Dashboards do not currently support segments, so more advanced audience isolation still belongs in Explorations.
Choose a default range so the dashboard opens ready for review. "Last 28 days" is a sensible default for many marketing teams, while "Last 7 days" fits weekly monitoring. That setting removes the routine date-picker adjustment at the start of a reporting session.
Step 5: Share Your GA4 Dashboard with Stakeholders
Publishing happens from the dashboard editor and adds the dashboard to the Reports navigation for property users. There is no separate public or private share link to generate. GA4 dashboard permissions control what recipients can see. An Editor and a Viewer can open the same dashboard, but only the Editor can change it.
A shared dashboard remains interactive. Viewers can change dates without changing anyone else's view. Dashboards are better suited to recurring KPI monitoring and stakeholder reporting, while Explorations are better suited to deeper analysis, segmentation, and one-off investigations. For executive reporting in GA4, that means a VP can review a channel breakdown without asking analytics to pull another cut of the data.
Info: Dashboards currently do not support API access, segments, or independent card-level comparisons. If the workflow calls for an internal-wiki embed or automated PDF snapshots, Looker Studio still handles it.
GA4 Explorations vs Dashboards: Choosing the Right Tool
The confusion around GA4 Explorations vs dashboards makes sense: both produce custom views. Their jobs differ. Dashboards are better suited to recurring KPI monitoring and stakeholder reporting, while Explorations are better suited to deeper analysis, segmentation, and one-off investigations. Explorations are designed for deeper, ad hoc analysis rather than as a persistent stakeholder-facing KPI surface. They support more advanced investigative techniques, but shared Explorations have more limited collaboration behavior than published dashboards.
| Dimension | GA4 Dashboards | GA4 Explorations | Looker Studio |
|---|---|---|---|
| Shareability | Published to all property users; interactive for viewers | More limited collaboration behavior when shared | Shareable via link or embed; scheduled emails |
| View Configuration | Supported dimensions and metrics configured in dashboard cards; no segments | Supports segments and advanced exploration techniques | Configured report pages and charts |
| Card / Widget Limit | 15 (standard) or 30 (360) | Not card-based; limits depend on exploration technique and configuration | No hard limit |
| Custom Segments | Not supported | Supported | No native GA4 segments; use report, page, or chart filters and calculated fields for custom logic |
| Data API Quota Impact | None (native rendering) | None (native rendering) | Consumes Data API quota; can hit limits at scale |
| Best Use Case | Daily KPI monitoring and executive summaries | Ad-hoc analysis and hypothesis testing | Complex blended reports and external sharing |
| Access Requirement | Editor+ to create; Viewer to read | Viewer+ to create personal explorations; Analyst+ to share | Google account with Looker Studio access + permission to the GA4 data source |
| Comparison as of September 2026. Looker Studio remains necessary for cross-property blending. |
Building an Executive Reporting Dashboard: A Practical Template
Executives generally need four answers: sessions, conversions, revenue or goal completions, and channel performance. They do not need 40 metrics. A useful executive reporting GA4 dashboard has six to eight cards, sequenced to tell the story from top to bottom.
Recommended card layout for an executive summary:
- Row 1: Three scorecards showing Total Sessions, Total Conversions, and Total Revenue, each displaying a percentage change based on the dashboard's previous-period comparison.
- Row 2: One line chart showing Sessions over Time by week, giving the trend at a glance.
- Row 3: One bar chart showing Conversions by Default Channel Group, so the exec sees which channels drive results.
- Row 4: One table showing Top 10 Landing Pages by Sessions, with Conversion Rate as a secondary metric.
For many teams, this GA4 reporting workflow removes the Looker Studio build-and-maintain cycle. There is no separate connector to manage, Data API quota to watch, or authentication issue to troubleshoot. The dashboard stays in GA4 and refreshes from the property's reporting data without requiring a separate connector.
Common Mistakes (and How to Avoid Them)
Hitting the card limit mid-build. It is easy to reach 15 cards and find there is no space left for the channel breakdown. Sketch the layout before opening the builder. Decide which metrics deserve their own cards and which fit as a dimension breakdown in an existing card.
Using Explorations-style metric combos that do not exist in the card builder. Dashboard cards do not expose every Explore metric. Segments, path analysis techniques, and card-level comparisons are unavailable. More advanced funnel analysis with segments or investigative techniques is a sign to use Explorations instead.
Sharing without checking permissions. Publishing a dashboard will not grant your CMO access if they were never added to the property. Confirm each recipient's GA4 property role before you share. No property access means no data.
Warning: Treating the dashboard as a full Looker Studio replacement. It is not. Cross-property blending, custom calculated metrics, and scheduled email delivery still belong in Looker Studio. The native dashboard can cover many routine daily monitoring needs, while more complex reporting workflows still require an external reporting layer.
Checking metric availability too late. Metric availability can differ between the dashboard builder and standard GA4 reports, so verify the available metric list in your property before planning the dashboard.
What GA4 Custom Dashboards Still Cannot Do
Limitations matter as much as the new features. As of September 2026, GA4 custom dashboards do not support cross-property blending, custom calculated card metrics, API access to dashboard data, segments, or independent card-level comparisons. Workflows that depend on those capabilities still require Looker Studio. Looker Studio, however, relies on the GA4 Data API and can run into quota limits in high-volume reporting.
GA4 also does not measure visibility in AI answer engines, community platforms, or local discovery surfaces. Teams monitoring organic visibility across search and AI answer engines can pair it with Vizup, which surfaces KPIs GA4 does not natively track, including AI citation share and answer engine presence. The Google Search Console link report is another source often paired with GA4 dashboards for a broader view of organic health.
GA4 remains the post-click measurement layer. Vizup extends that workflow into modern organic discovery, helping teams monitor, create, optimize, publish, and learn across Search, Social, Communities, AI Answer Engines, and Local Discovery using AI agents, human experts, and live SEO, pSEO, AEO, and GEO tools. That makes the two layers complementary: GA4 shows what users do after arriving, while Vizup helps teams understand and improve the organic visibility that creates discovery in the first place. Paid ads can then be used as an amplification layer when needed.
Summary and Next Steps
The build is simple: open Reports, click + Create, choose Dashboard, name the blank dashboard, configure up to 15 cards - or 30 in GA4 360 - configure dimensions and a default date range, then publish it from the dashboard editor for the team. The result is a persistent, interactive reporting view designed for recurring KPI monitoring and stakeholder reporting, while Explorations remain better suited to deeper analysis, segmentation, and one-off investigations.
Audit the Explorations your team already uses. Rebuild any view opened more than once a week or regularly shared with colleagues as a dashboard, then verify that stakeholders have the needed property roles. For tracking Google Ads search terms alongside organic metrics, weigh a single dashboard against a paired Looker Studio report based on the reporting need.
Frequently Asked Questions
How many cards can a GA4 custom dashboard have, and does GA4 360 raise the limit?
Standard GA4 properties allow up to 15 cards on a dashboard. GA4 360 raises the limit to 30. Plan the card layout before building so the available slots go to the metrics that matter most.
Can I share a GA4 custom dashboard with someone without a GA4 account?
No. Recipients need access to the GA4 property. Add them as at least a Viewer in Admin > Property Access Management before they can open a published dashboard.
What separates GA4 Explorations from dashboards, and when should I use each?
Dashboards are better suited to recurring KPI monitoring and stakeholder reporting, while Explorations are better suited to deeper analysis, segmentation, and one-off investigations. Explorations support more advanced investigative techniques, but shared Explorations have more limited collaboration behavior than published dashboards.
Is the GA4 dashboard builder a real Looker Studio alternative, or do I still need both tools?
For daily KPI monitoring and executive summaries, the GA4 dashboard builder can replace Looker Studio for many teams. It avoids Data API quota concerns and separate-tool maintenance. Looker Studio is still required for cross-property blending, calculated metrics, scheduled email delivery, and embedded reports. The native builder is an alternative for GA4 monitoring, not complex multi-source reporting.
Can every GA4 metric be used in a custom dashboard?
No. The dashboard builder does not expose every metric or analysis option available elsewhere in GA4. Check metric availability in the card configuration before committing to a dashboard layout, and use Explorations when you need metrics or analysis techniques that are not supported.
