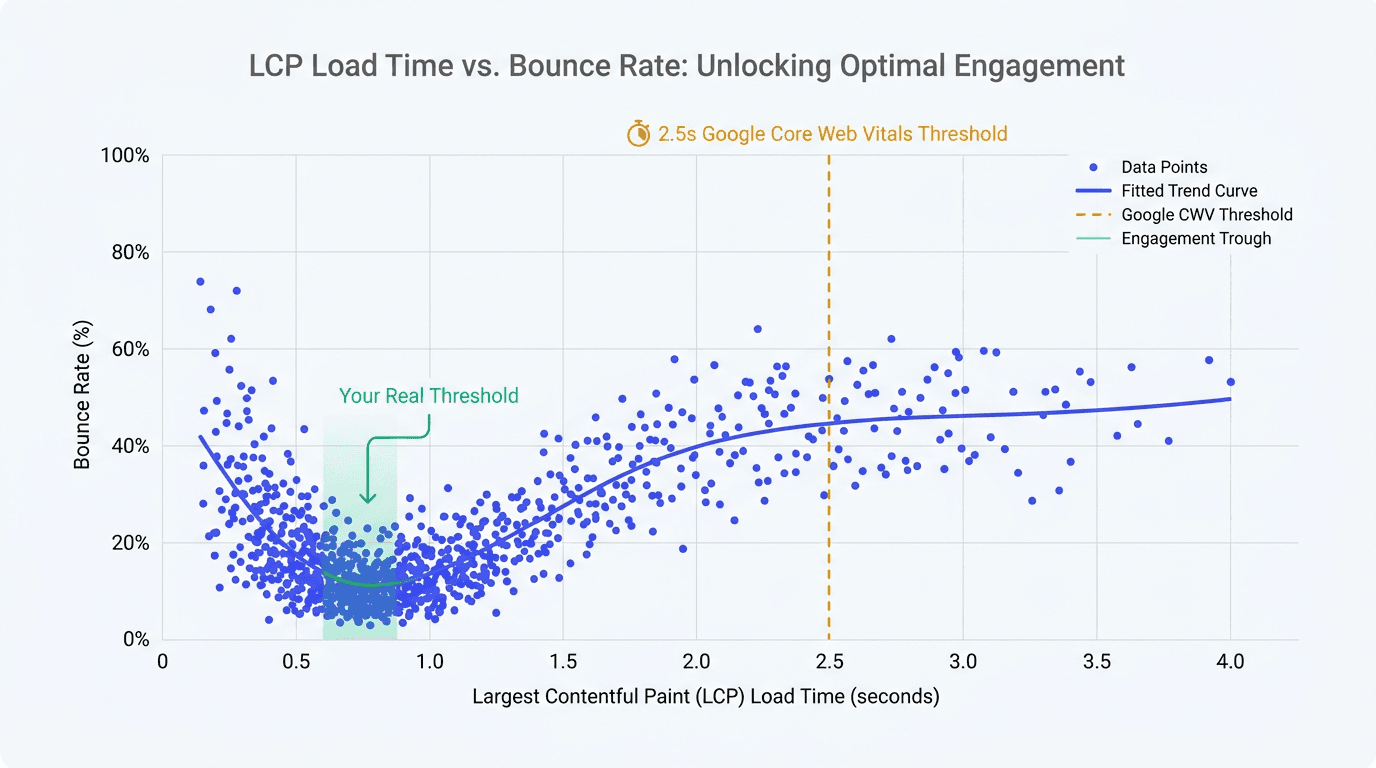
If your team treats the core web vitals LCP threshold as the finish line, you are probably leaving money on the table. Passing "good" is a baseline, but user expectations and competitive ecommerce SERPs do not stop at a pass mark.
I distrust universal thresholds when teams use them as business targets. The only number that matters after you pass is the one your own users reward. That number lives in your RUM, and it is often faster than you think.
The 2.5-second 'Good' LCP is a standard for the web, not your engagement optimum
Google's guidance is clear: an LCP of 2.5 seconds or less is "good," evaluated at the 75th percentile of page loads across mobile and desktop field data (CrUX). That remains Google's threshold for classifying LCP as 'good,' although passing it does not guarantee stronger rankings or better business outcomes. See Google's definition in Largest Contentful Paint (LCP).
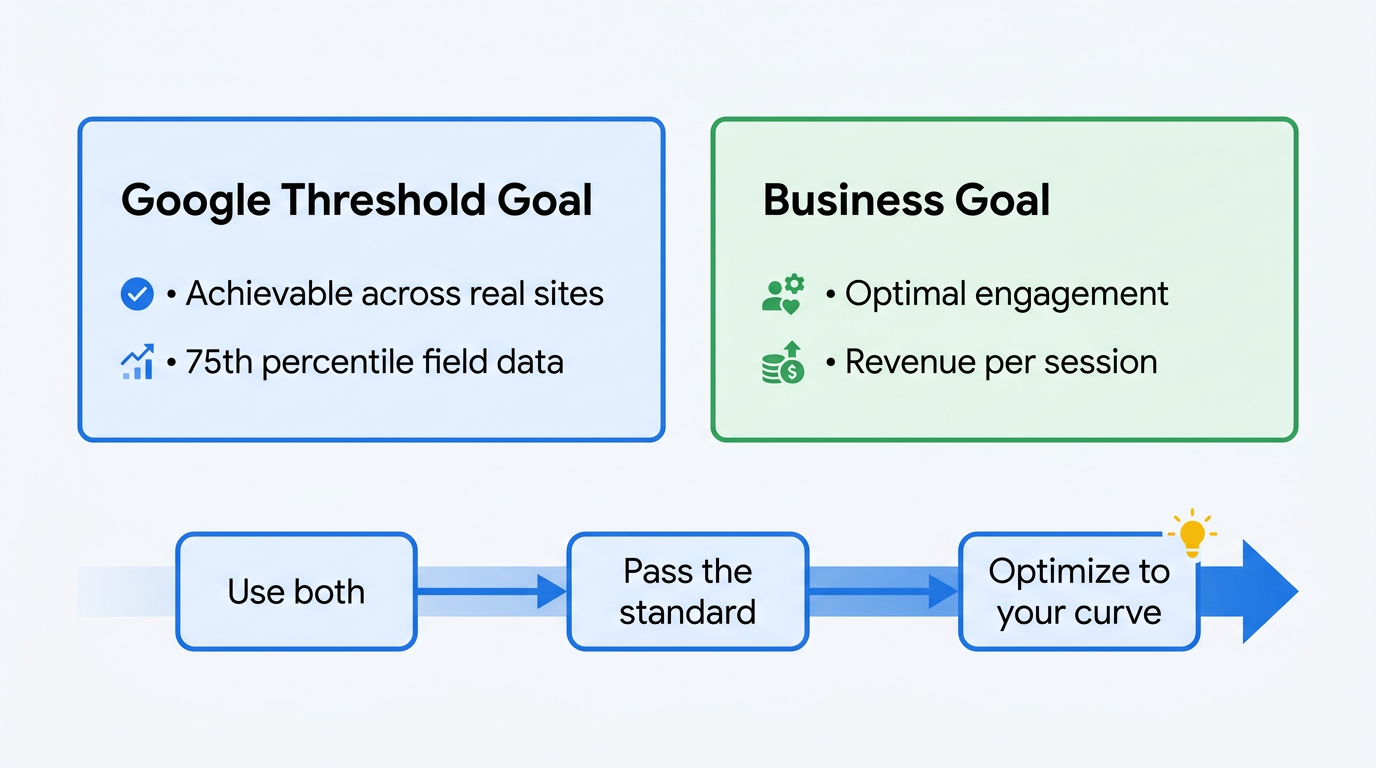
What many teams miss is why that number exists. Google documents that Core Web Vitals thresholds are designed to be achievable across real sites, not to represent the point of maximum engagement for every business. That design goal is explained in Defining the Core Web Vitals thresholds. Baseline thresholds and engagement optima are different problems, and conflating them is a recurring mistake.
Two truths can coexist without contradiction:
- LCP 2.5 seconds is a legitimate pass or fail bar for the 75th percentile of field data, and your site should meet it.
- Your internal target should be the LCP range where your users stop bouncing and start buying, which can be far earlier than 2.5 seconds.
- If you are already on a plateau, shaving 200 ms might not move bounce rate at all, even though it feels like progress.
Warning: Handle the headline number carefully: A study of ten retailers found the LCP tied to the best bounce rate ranged from roughly 100 ms to 1 second. That is not a new universal target, and the author explicitly says so. The contribution is the methodology: use your own RUM to find your trough and plateau, then set an internal target. Keep 2.5 seconds as the official pass or fail bar.
Your site has an engagement curve, and it usually has a trough and a plateau
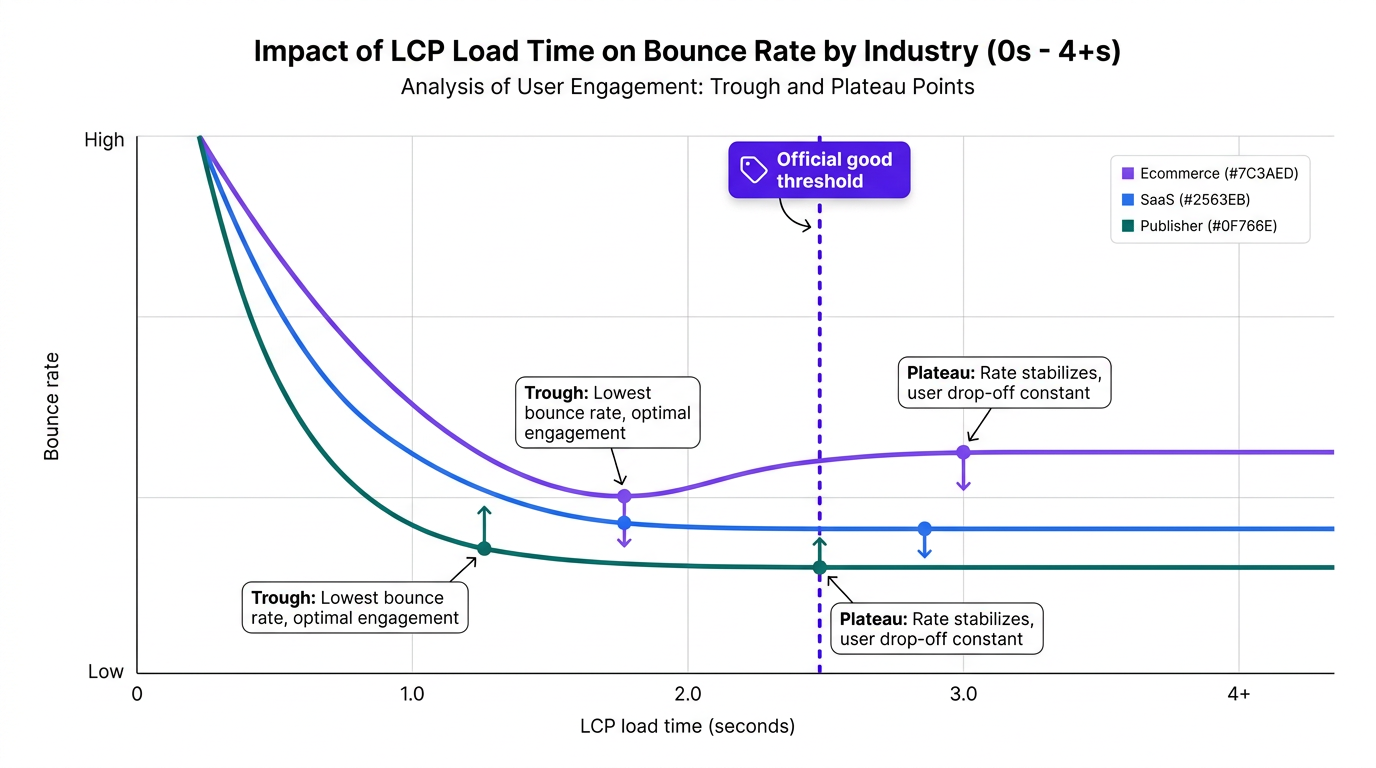
When you plot LCP against a behavior metric, you rarely get a straight line. You get a curve: engagement improves as LCP drops, then at some point the curve bottoms out (your trough), and after another point improvements flatten (your plateau). That shape is the practical meaning of page speed and engagement for teams that actually ship code.
The retailer study referenced in the callout above is useful because it demonstrates variance. Across ten retail sites, the LCP value tied to best bounce rate ranged from about 100 ms to 1 second, and for several sites 2.5 seconds already sat on the plateau where more speed stopped helping bounce rate. Read it for the method, not the number: Embrace research on Core Web Vitals.
This is also why I push teams to stop treating Core Web Vitals as a checkbox inside an audit. Performance belongs inside a broader diagnostic loop that connects technical metrics to outcomes, the same way you would approach a modern ecommerce SEO audit.
How to map LCP to bounce rate using RUM data
A workflow that has held up across ecommerce and content sites:
- Collect session-level rum data LCP (field data), and ensure it can be joined to engagement events (bounce, add-to-cart, checkout start, revenue). Use your RUM stack or analytics instrumentation, but make sure performance and behavior share the same session key.
- Bin LCP into ranges (for example 0 to 250 ms, 250 to 500 ms, 500 to 750 ms, 750 to 1000 ms, then 250 ms bins up to 4000 ms). Do not overfit with 10 ms bins unless you have massive traffic.
- Compute bounce rate per bin, plus confidence intervals if you can. Small bins with low traffic lie to you.
- Plot the curve and mark two points: the lowest bounce rate bin (your optimal LCP bounce rate trough) and the first bin where improvements stop producing meaningful bounce changes (your plateau).
- Set an internal LCP target as a range, not a single number, and tie it to an outcome KPI. For the KPI framing, see SEO KPIs vs SEO metrics.
Info: Analysis Safeguards: A higher bounce rate could be attributed to LCP when the real cause is something else. Control for confounding variables by segmenting your analysis by mobile versus desktop, network quality, geography, new versus returning visitors, page or template type, and traffic source. Also, ensure your sample size per bin is large enough to be statistically significant.
Also clarify what "bounce" means for your analytics. In Google Analytics 4, bounce rate is the percentage of non-engaged sessions, which is different from the definition used in Universal Analytics. An engaged session in GA4 is one that lasts longer than 10 seconds, has a key event, or has at least two pageviews. A session that does not meet any of these criteria is considered a bounce.
For a sanity check on whether your field sample is representative, compare it to public CrUX aggregates for your origin. CrUX is field data from real Chrome users, described in What is CrUX?.
What your curve means for prioritization, budgets, and engineering tradeoffs
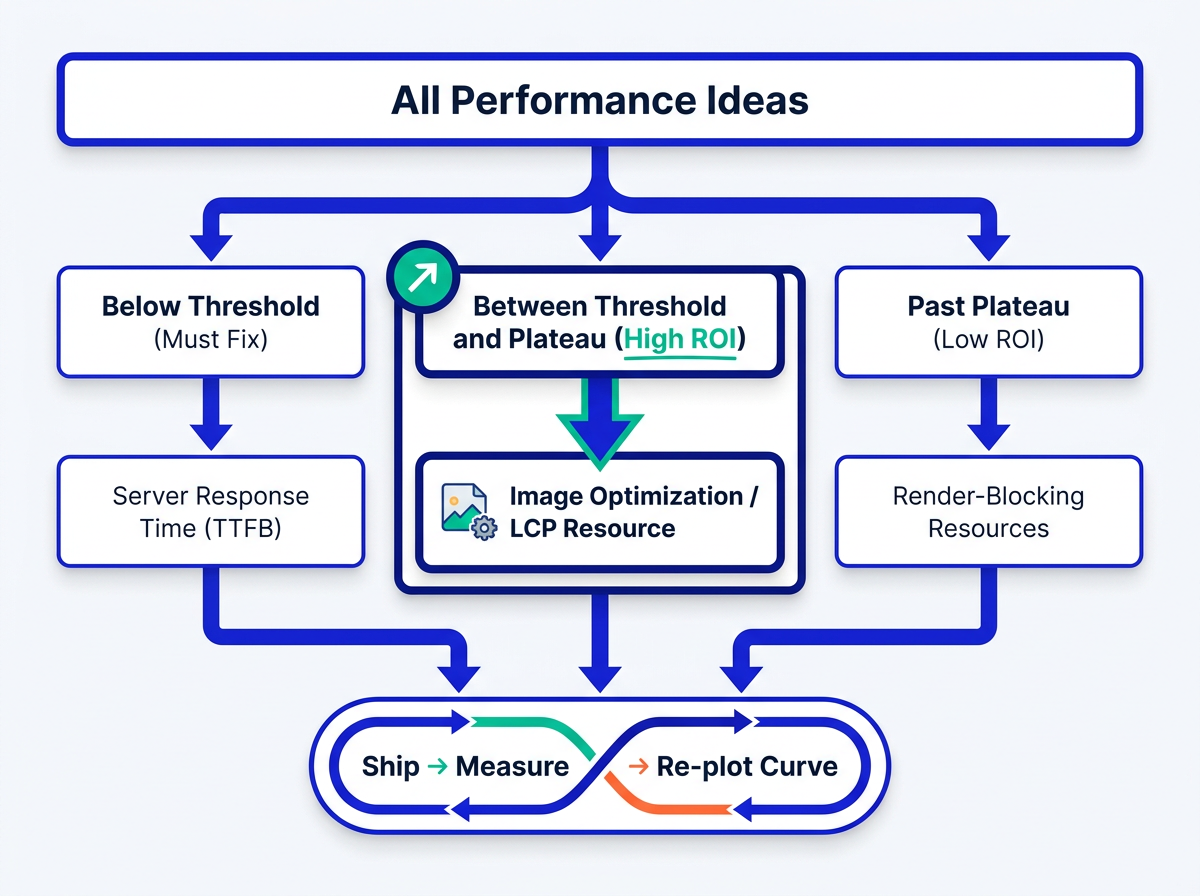
Once you have a curve, prioritization gets less political. You can stop arguing about whether performance is "done" and start asking where you are on the curve. A p75 LCP of 2.4 seconds on the steep part of that curve means performance work is a revenue project. On the plateau, you may get more ROI from fixing UX friction, merchandising, or crawl waste.
Real examples exist where LCP changes moved business metrics. Google shared a Renault case study where a 1 second improvement in LCP correlated with a 14 percentage point drop in bounce rate and a 13% increase in conversions (web.dev, 2021). That is not a promise for every site, but it is a reminder that performance is not just "technical SEO."
Service scope also gets clearer here. If you are hiring help, you want a team that can connect performance fixes to outcomes and monitoring, not just run Lighthouse and ship a checklist. That is the difference between generic work and real technical SEO services.
This is where Vizup fits: an Organic Autopilot for modern discovery that helps brands monitor, create, optimise, publish, and learn across Search, Social, Communities, AI Answer Engines, and Local Discovery. Vizup combines AI agents, human experts, and live SEO, pSEO, AEO, and GEO tools, while paid ads remain an optional amplification add-on.
The strongest counterargument: custom targets waste time, 2.5 seconds is simple
The appeal of simplicity is real. "Hit 2.5 seconds and move on" is easy to communicate, easy to report, and easy to budget. It also aligns with how Google evaluates the metric. If LCP is poor (especially on commercially important templates) it deserves priority, but it should still be weighed against relevance, indexing, UX friction, and other constraints affecting organic performance.
Where I disagree is what happens after you pass. In competitive ecommerce, the marginal gains between 'good' and 'great' can influence who earns the click, retains visitors, and converts mobile shoppers. Treating lcp 2.5 seconds as a ceiling is a strategic mistake, not a technical one.
The compromise that works in real orgs is a two-tier system: keep Google's threshold as the external compliance bar, and add an internal, outcome-based target derived from your curve. Reporting stays clean while the product keeps moving forward. For a broader UX and conversion framing for that internal target, the playbook overlaps with the 2026 guide to AI and UX for conversion optimization.
What this means for Core Web Vitals thresholds in 2026 and beyond
The HTTP Archive's 2025 Web Almanac reported that 62% of mobile pages and 74% of desktop pages achieved a good LCP under 2.5 seconds. That does not mean Google will necessarily lower the threshold, but it does show that passing the public benchmark is increasingly common. See the Web Almanac performance chapter.
As of July 2026, Google still classifies an LCP of 2.5 seconds or less as "good" when measured at the 75th percentile and segmented by mobile and desktop. Rather than trying to predict a future threshold change, teams should maintain that external benchmark while using their own RUM data to establish outcome-based internal targets.
My take: the teams that win build a culture of measurement rather than memorizing a number. If you can plot performance against outcomes, you can adapt no matter where Google sets the bar.
FAQ
What is a good LCP score in 2026?
Google still recommends 2.5 seconds or less for LCP, measured at the 75th percentile of real user (field) loads across mobile and desktop. That is the "good" bar for reporting and Core Web Vitals evaluation per web.dev's LCP documentation.
Does LCP still matter for SEO?
Yes. Core Web Vitals are evaluated using real user field data, and LCP remains a major bottleneck for many mobile sites. It also correlates with user behavior, which affects revenue and brand demand even when rankings do not visibly shift.
How do I find my site's optimal LCP if it's not 2.5 seconds?
Use your own RUM: join session-level LCP to bounce rate or conversion, bin LCP, and plot the curve. Your target is the trough (lowest bounce or highest conversion) and your stopping point is the plateau where improvements stop moving the metric. The Embrace study demonstrates this methodology across retailers: research on Core Web Vitals.
What's the difference between RUM data and Lab data for LCP?
RUM (field) data measures real users on real devices and networks, and it is what Google uses for Core Web Vitals via CrUX. Lab data is simulated and useful for debugging, but it can miss real-world variance. For field data context, see Chrome UX Report (CrUX) documentation.
Will Google lower the Core Web Vitals LCP threshold in the future?
Google has not announced a specific change, but thresholds are designed around what is achievable across real sites, and the web's performance distribution shifts over time. If you build internal targets from your own engagement curve, threshold changes matter less because you are optimizing to user outcomes rather than compliance alone.
Stop treating 2.5 seconds as the finish line, and own your real number
The core web vitals LCP threshold is a floor. Pass it, report it, and respect what it is designed to do. Then do the work Google cannot do for you: measure your own users, find your trough, identify your plateau, and set an internal target that matches how your business actually makes money.
One practical next step: pick your top revenue templates (home, category, PDP, cart), pull 30 days of RUM, and plot LCP against bounce rate and conversion. Then socialize the curve. It ends the "we hit good, we are done" mindset fast, and it gives engineering a target that is defensible.
