
For years, referral traffic has been the comfort food of marketing reports: easy to slice, easy to trend, easy to turn into a strategy deck. Now there’s a new strand showing up from ChatGPT, Perplexity, [Claude](How to Connect Google Search Console to Claude Using MCP ) and Google’s AI Overviews. It doesn’t behave like the referrals you’re used to. It’s messy, it’s sporadic, and most analytics stacks either mislabel it or miss it entirely. Still, when a new source starts sending people who look ready to act, you pay attention.
This is for marketers and SEO teams trying to get serious about LLM referral traffic optimization. No theory, no hand-waving: set up tracking, read what the numbers are actually saying, and turn AI-driven visits into outcomes you can defend. You’ll walk away knowing where this traffic hides, how to evaluate it, and which avoidable mistakes keep teams from capitalizing on it.
First, What Is LLM Referral Traffic and Why Does It Matter?
Start with the mechanics. An LLM (Large Language Model) powers tools like ChatGPT and Claude. When one of those tools answers a question and includes a link to your site, that’s a referral opportunity. If the person clicks the link, that session is LLM referral traffic.
So why bother? The volume is still small, often under 2% of total referrals on average. But it’s moving fast. Some studies have noted significant year-over-year growth in traffic from AI sources. The more interesting part is quality. Some analyses have reported high conversion rates for LLM referrals, well above many other channels. These users aren’t wandering in from a vague headline. They’ve already had the basics summarized by an AI, and the click is usually about finishing a specific job: compare options, confirm details, or take the next step.
Setting Up Your Tracking: Seeing the Unseen
Optimization starts with visibility. If you can’t reliably spot AI referrals, you can’t improve them. In tools like Google Analytics, default reporting often shoves AI traffic into "Referral" or, worse, "Direct". Creating a custom channel group is the cleanest way to make it show up consistently.
Here’s a no-nonsense way to do it in GA4:
- Navigate to Admin > Data settings > Channel Groups. Click 'Create new channel group'.
- Create a New Channel. Name it “AI Referrals”.
- Define the Rule. Set a condition where 'Session source' matches a regular expression (regex) of known AI referrers. Start with a basic list like
chat.openai.com|perplexity.ai|gemini.google.com|copilot.microsoft.com|claude.ai. - Order Matters. This is the step everyone misses. Drag your new 'AI Referrals' channel above the 'Referral' and 'Direct' channels. GA4 assigns traffic to the first rule it matches, so if you leave it at the bottom, it will never get populated.
- Save and Wait. It can take 24-48 hours for data to start flowing into your new channel.
But client-side analytics isn't the whole story. Many AI referrals are misclassified because the referrer information is lost or never sent. To get a truer picture, you need to look at server-side data. CDN or server logs capture every request, including the user-agent and referrer, before they get misinterpreted by browser settings or analytics quirks. By analyzing these logs for traffic from known AI platform IP ranges or with specific referrer patterns (including Claude-related referrers when they appear), you can often uncover a significant amount of AI traffic that GA4 misses. It's more technical, but it’s the only way to get closer to the real number.
It’s not a perfect net. Google’s AI Overviews typically blend into organic search, and some AI apps won’t pass a referrer at all. But this gets you out of the dark and into a directionally correct view of which platforms are actually sending visitors.
Top Referral URLs: Which AI Sources Are Actually Sending Clicks?
Just knowing chat.openai.com sent you traffic isn't enough. Was it from a shared link, a specific chat session, or a plugin? The full referring URL holds the clues. In GA4, the default reports often just show the domain. To see the full path, you need to build a custom exploration.
Here’s how to find the full URLs in GA4:
- Go to Explore and create a new blank report.
- Add the 'Page referrer' dimension. This is the key field that contains the full URL of the referring page, not just the domain.
- Add metrics like 'Sessions' and 'Conversions'.
- Set 'Page referrer' as your primary row dimension.
- Filter for your AI sources. Add a filter where 'Page referrer' contains the domains from your AI channel group (e.g.,
openai.com,perplexity.ai,claude.ai, etc.).
When you analyze the results, you'll start seeing patterns. A URL like chat.openai.com/share/b1a2c3d4-e5f6-g7h8-i9j0-k1l2m3n4o5p6 indicates a publicly shared chat. This is gold. It tells you exactly what conversation led to the click. Other times you might just see the base domain, which often points to traffic from users who aren't logged in or are using mobile apps where referrer data is less consistent. You’ll see similar quirks across other assistants too, including Claude, where the referrer can be clean, partial, or missing depending on how the user opened the link.
Filtering Your Dashboard for Deeper Insights
Once your data is flowing, the real work is in the analysis. A raw traffic number is just noise. The insights come from filtering. Your dashboard should allow you to slice the data by several dimensions to answer specific questions.
Think of these as lenses to view your traffic:
- By Date Range: Are AI referrals growing month-over-month? Did a specific blog post cause a spike last week?
- By AI Platform: Is Perplexity sending higher-converting traffic than Gemini or Claude? Does one platform favor a different type of content?
- By Page Intent: Filter for your "pricing" or "comparison" pages. Are they converting AI visitors as expected?
- By Channel Source: Compare the behavior of your "AI Referrals" segment against "Organic Search" or "Paid Social." Is the quality different?
- By Device Type & Region: Are mobile users from the UK behaving differently than desktop users from the US?
Filtering turns a vanity metric into a diagnostic tool. A high bounce rate isn't just a number; it's a high bounce rate from a specific AI platform, on mobile, to your main product page. Now you have a problem you can actually investigate.
Analyzing the Traffic: Source and Page Performance
After you’ve let the channel run for a couple of weeks, move from counting sessions to reading intent. This is where you connect the dots between the AI source and the on-page result. Two tables are essential here.
| AI Source | Visits | Bounce Rate | Conversion Rate | Channel Type | Notes |
|---|---|---|---|---|---|
| ChatGPT / OpenAI | e.g., 1,200 | e.g., 45% | e.g., 2.5% | Earned | High volume, broad intent. |
| Claude / Anthropic | e.g., 220 | e.g., 40% | e.g., 2.2% | Earned | Often strong for research and drafting workflows, watch landing-page fit. |
| Perplexity | e.g., 450 | e.g., 35% | e.g., 3.1% | Earned | Often more research-focused, lower bounce. |
| Gemini / Google | e.g., 300 | e.g., 50% | e.g., 1.8% | Earned | Traffic often blends with Organic Search. |
| Copilot / Microsoft | e.g., 150 | e.g., 55% | e.g., 1.5% | Earned | Volume can be lower but depends on audience. |
| Other | e.g., 50 | e.g., 60% | e.g., 1.0% | Earned | Catch-all for smaller or new platforms. |
| Landing Page | LLM Traffic | Bounce Rate | Consent Rate | Page Intent | Conversion Action | Optimization Action |
|---|---|---|---|---|---|---|
| /blog/widget-comparison-guide | High | Low | 95% | Comparison | Demo Request | Sharpen CTA |
| /pricing | Medium | High | 92% | Pricing | None | Add FAQ/Proof |
| /docs/api-setup | Low | Low | 98% | How-To | Signup | Monitor |
| /product/feature-x | High | High | 90% | Feature Info | None | Clarify Answer |
Then put conversions next to the landing pages. Which AI-referred entries are producing key events? A page that draws clicks but never converts usually means a promise gap: either the model is framing your content in a way your page doesn’t support (yes, this happens with Claude too), or the page itself doesn’t deliver what the user expected. Either way, you’ve found something you can fix. If you want to go deeper on behavior patterns, Vizup's Pattern Analyzer can help tie landing pages to conversion paths.
From Citation to Click: Optimizing the Connection
Referral traffic doesn't happen in a vacuum. It's the result of your content being cited by an AI. The key is to understand and improve that initial citation. You can manually check for citations by asking AI platforms (ChatGPT, Claude, Perplexity, Gemini) questions related to your expertise and seeing if your site appears. Once you identify which pages are getting cited, you can analyze their performance.
Think about your pages in four categories:
- Cited and Clicked: If a page is cited and receives traffic, the connection is working. The goal here is to optimize the on-page experience for those pre-qualified visitors.
- Cited but Not Clicked: This means the AI found your content useful for its answer, but the user didn't need to click for more. This isn't a failure; it's a brand visibility win. The goal is to ensure the AI's summary is accurate and positive.
- Needs a Clearer Answer: If a cited page has a high bounce rate, the AI might be misinterpreting your content or the page itself is confusing. Adding FAQs, comparison tables, or a clearer summary can help.
- Needs More Authority: To get cited in the first place, your content needs to be perceived as authoritative. This involves adding unique data (proof), using schema markup for structure, building relevant internal links, and having strong CTAs.
Page-Level Optimization: Aligning Content with High-Intent Visitors
This is where the work starts paying off. LLM traffic arrives "pre-briefed" from a Q&A session, which means less tolerance for meandering intros and more demand for the point. Your landing page has to confirm they’re in the right place within seconds.
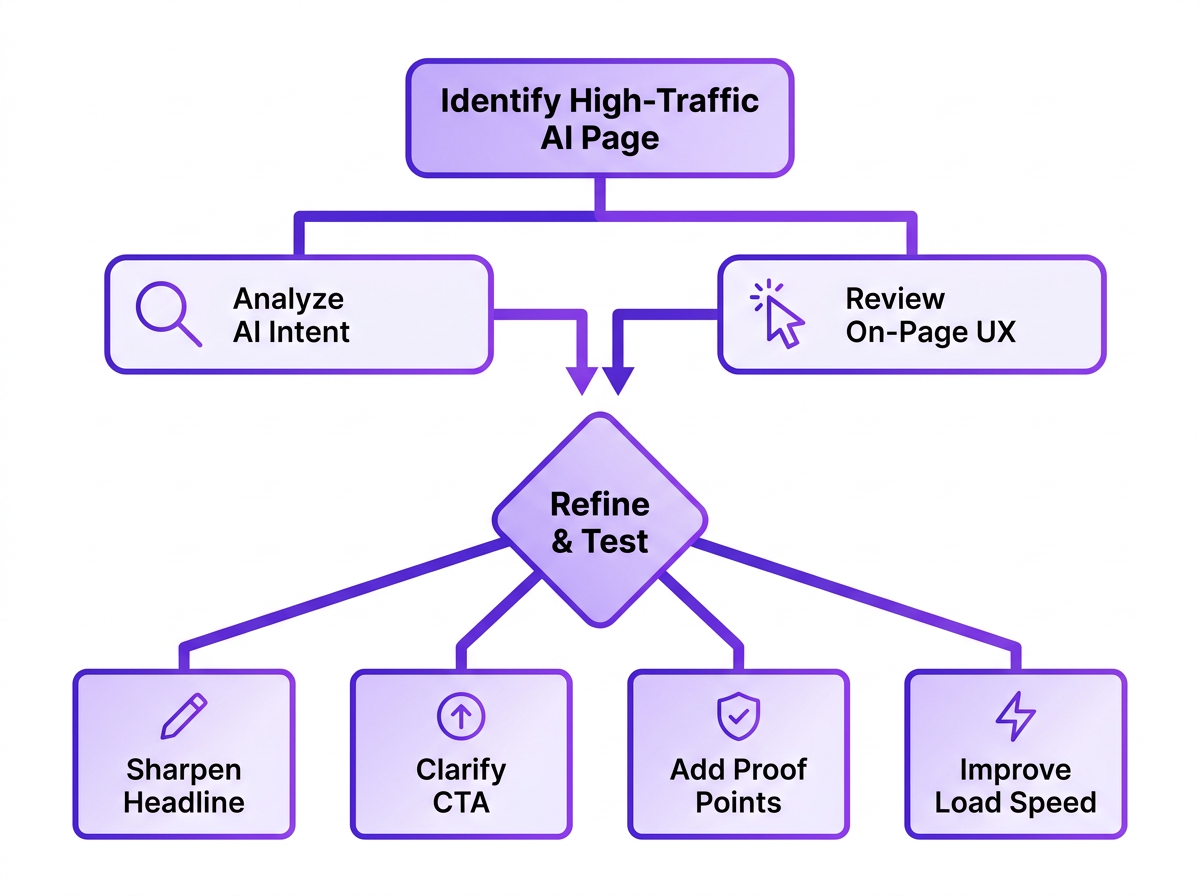
For your top AI-referred pages, do this:
- Match the Implied Promise: If an AI is citing your page as the answer to “best project management tools for small teams,” your page better deliver that comparison immediately. Don't bury it behind a long intro. Lead with the answer.
- Sharpen the Call-to-Action (CTA): “Learn More” is rarely specific enough. If the click came from a features question, point the CTA toward a demo or a feature-level explanation that continues the thread. That’s where AI and UX for conversion optimization principles start to matter.
- Add Trust Signals and Proof: These visitors are often mid-evaluation. Give them what they need to commit: case studies, testimonials, concrete data points, and pricing that’s easy to find. Your job is to remove doubt, not just add words.
- Ensure Technical Excellence: Keep it fast, mobile-friendly, and easy for bots to parse. That’s table stakes for UX, and it’s also part of making your website AI-agent friendly so you keep earning citations.
Reporting and Communicating Results
Tracking is for you; reporting is for your team. A monthly review of your LLM referral dashboard can provide valuable insights for different departments. Don't just export a CSV and email it. Translate the data into stories.
Tailor your report for the audience:
- For the SEO Team: Highlight which content topics are gaining traction with AI (including Claude citations and clicks). This can inform future keyword and content strategy.
- For the Content Team: Show them which pages are driving high-quality traffic and which are bouncing. This is direct feedback on what's working.
- For Leadership: Focus on the bottom line. Report on the conversion rate and assisted conversions from AI referrals to demonstrate ROI.
- For the Conversion Team: Pinpoint pages with high AI traffic but low conversion. These are prime candidates for A/B testing and UX improvements.
Common Mistakes I See Every Week
Teams are rightly curious about AI traffic, and then they step on the same rakes. A few patterns show up over and over.
Obsessing over volume. The counts are small today. The signal is in conversion rate and what the traffic teaches you about demand, not the raw session total. Ten visits that convert beat a thousand that bounce, which is why why traffic metrics can be misleading keeps coming up in serious reporting.
Ignoring 'dark' AI traffic. Plenty of AI influence never shows up as a tidy referrer. Someone sees your brand in ChatGPT or Claude, opens a new tab, and searches you by name; GA will file that under "Direct" or "Organic Search." Some studies suggest a notable percentage of users may use AI before visiting a site. You won’t catch that in referral reports, but you can watch for timing: increased AI visibility paired with bumps in direct or branded search traffic.
Setting and forgetting. AI search visibility optimization doesn’t sit still. Models change, products ship, and user habits drift. Treat your dashboard and the underlying rules as something you review quarterly, not something you configure once and never touch again.
What an LLM Referral Traffic Dashboard Should Track
A good dashboard tells a story, starting with the big picture and letting you drill down into the details. Inspired by the approach of comprehensive analytics platforms like Adobe's referral dashboards, a purpose-built view for LLM traffic should connect the dots from source to outcome. It’s not just about counting clicks; it’s about understanding value.
Your dashboard should be built around these key metrics:
- Core Traffic Metrics: Start with the basics: Total Referral Traffic, LLM Referral Traffic, and LLM Traffic Share (as a percentage of total referrals). This frames the scale.
- Source & Platform Performance: Break down traffic by Referral Source (e.g., chat.openai.com) and Platform (e.g., ChatGPT, Claude, Gemini). This tells you which AI ecosystems are sending visitors.
- Engagement & Quality: Track Bounce Rate, Consent Rate (if applicable), and Conversion Rate. High-quality traffic should engage and convert, not just arrive.
- Content Performance: Which Landing Pages are receiving this traffic? What is the inferred Page Intent (e.g., comparison, pricing, how-to)? This connects AI citations to your actual content.
- Audience & Context: Layer on dimensions like Device Type and Region to understand who these users are and where they're coming from.
- Attribution & Influence: Don't forget Assisted Conversions. An AI referral might not get the final click but could be a key touchpoint in a longer user journey.
Frequently Asked Questions
Which AI platform sends the most referral traffic?
Recent reports suggest ChatGPT drives a significant majority of tracked AI-driven visits, though the exact percentage fluctuates. It's crucial to track your own data, as the mix can shift quickly and vary by industry. In some accounts, Claude shows up as a smaller but meaningful slice once you explicitly track it.
How is LLM optimization different from traditional SEO?
Traditional SEO is largely about ranking for keywords. LLM optimization is about getting cited as a trusted source inside an AI-generated answer (whether that answer is coming from ChatGPT, Claude, Gemini, or another assistant). That usually puts more weight on clarity, structured data, and direct answers than on keyword density and backlinks alone.
Can I use UTM tags to track AI traffic?
Only when you control the link placement, which you usually don’t. You can’t append UTMs to links an AI model generates on its own, so referrer-based tracking in your analytics platform remains the most practical option for now.
Should I block AI crawlers from my site?
It's a trade-off. Blocking crawlers like GPTBot can reduce your content's discoverability for AI citations and referrals. However, some organizations may choose to restrict access for specific legal, privacy, server load, or content ownership reasons. It's not an all-or-nothing decision; you can use robots.txt to block crawlers from certain parts of your site while allowing access to public, promotional content.
How long does it take to see results from LLM optimization?
It depends. Once tracking is in place, you’ll see baseline traffic right away. After you optimize a page, timing hinges on how often models re-crawl your site and refresh their knowledge. Plan in quarters, not days.