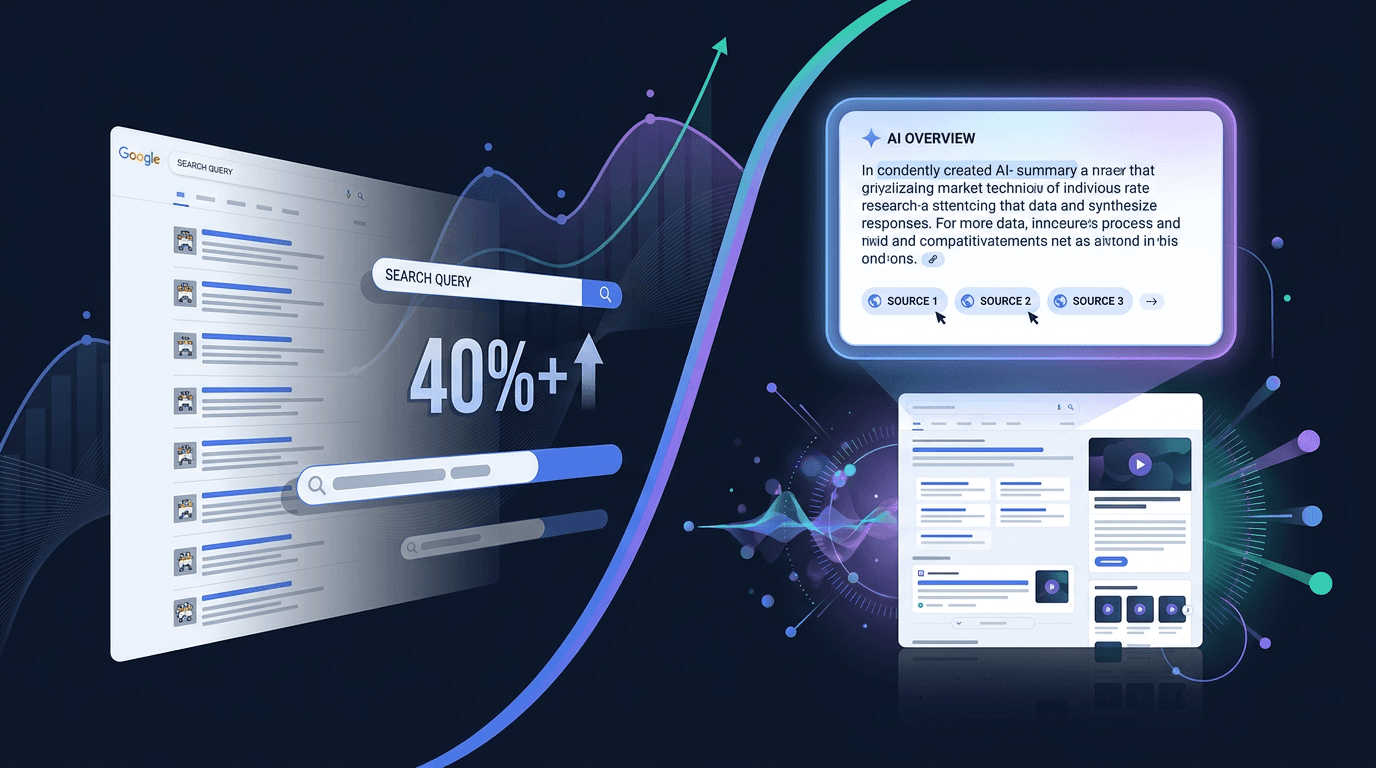
The AI Overviews trigger rate measures how often a Google query results in an AI-generated summary sitting above the familiar list of links. Marketers watch it because it is a rough proxy for two things they actually care about: where their brand can appear in a reshaped SERP, and how much traffic is exposed when answers get pulled up and compressed.
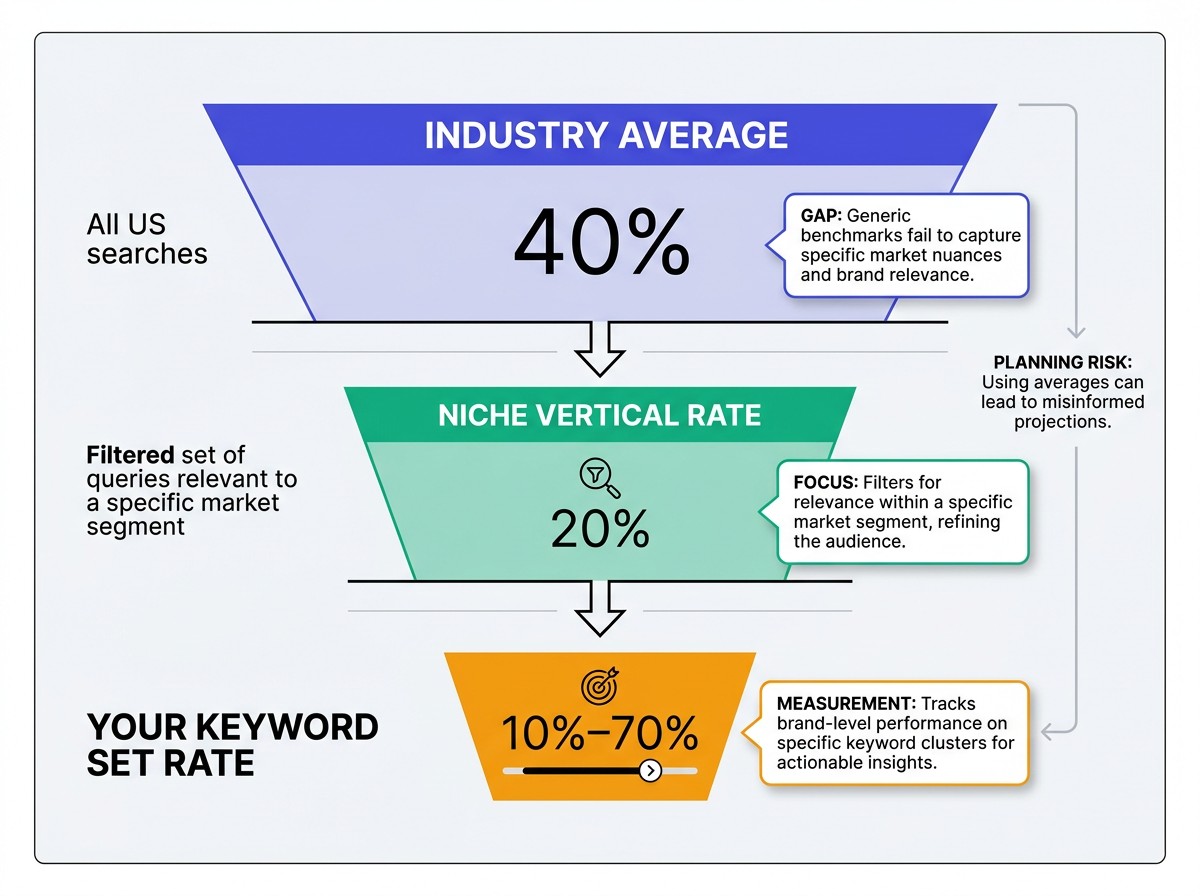
Similarweb's 2026 Generative AI Landscape Report pegs the number at more than 40% of US searches, and that is the kind of headline that sends forecast models back to the whiteboard. Before anyone builds a 2026 budget around it, though, one question matters more than the number itself: is that sample anything like your keyword universe? For most teams, it is not. The more urgent signal is sitting next to the trigger-rate debate: queries are getting longer, and that shift changes what "visibility" even looks like.
The 40% Question: Why Do AI Overview Trigger Rates Vary So Much?
Similarweb is hardly alone in publishing a trigger-rate estimate. Semrush's 2025 study of more than 10 million keywords found that AI Overviews had settled at around 16% of queries by November 2025. BrightEdge, working from a different panel and definition set, put AI Overviews on roughly 48% of US queries in early 2026. Same feature, same market, three materially different answers. If you start from methodology instead of the headline, that spread is not surprising. If you are trying to justify spend with a single number, it is a headache.
Most of the gap comes down to four inputs that vendors rarely match: device mix, geographic scope, how the sample tilts by intent, and what kind of panel or crawl is doing the measuring. This is not trivia for analysts. It is the difference between a number that helps planning and a number that quietly misleads it.
| Factor | Low Estimate Scenario | High Estimate Scenario |
|---|---|---|
| Device Mix | Desktop-only panel; some data suggests AI Overviews appear more on desktop | Mobile-weighted sample; other data suggests mobile prevalence is growing faster |
| Query Type | Sample dominated by navigational and branded queries | Sample dominated by informational, question-based, and research queries |
| Data Source | Clickstream panel skewed toward commercial intent | Broader crawl panel capturing DIY, health, and how-to verticals |
| Geography | Includes markets where AI Overviews have limited rollout or different behavior | US-only or English-language-only sample with full feature availability |
| Measurement Window | Captured during a narrower rollout phase | Captured after broader availability expansion in 2025-2026 |
| Methodology choices, not market reality, explain most of the gap between published trigger rate figures. |
Device and Location Mix
Device and location can affect measured prevalence because SERP experiences, feature availability, and user behaviour vary across surfaces and markets. Some 2026 data suggests desktop AI Overviews appear more frequently than mobile versions. Other studies focusing on year-over-year growth show mobile prevalence increasing at a very high rate. Meanwhile, Google's rollout of AI Overviews has been staggered, with availability expanding to over 200 countries and territories by mid-2025. A measurement set that includes markets with different rollout timelines or user behaviors will produce a different average than a US-only sample.
Query Intent and AI Mode Search Behaviour
Intent is where trigger-rate averages get especially slippery. Informational searches, the "how does," "what is," and "why does" kind, are much more likely to produce AI Overviews than navigational or transactional queries. A dataset full of long-tail research questions will, by design, spit out a higher ai overviews trigger rate than one dominated by brand lookups or product hunting. The behavior Google encourages in its conversational AI Mode offers a window into this effect: as users learn they can ask multi-part questions, more queries may drift into the informational bucket that AI Overviews tend to reward. The mechanics of how AI search engines cite content also help explain why some query shapes are simply easier for these systems to summarize and attribute.
The Real Story Is Query Length, Not the Trigger Rate
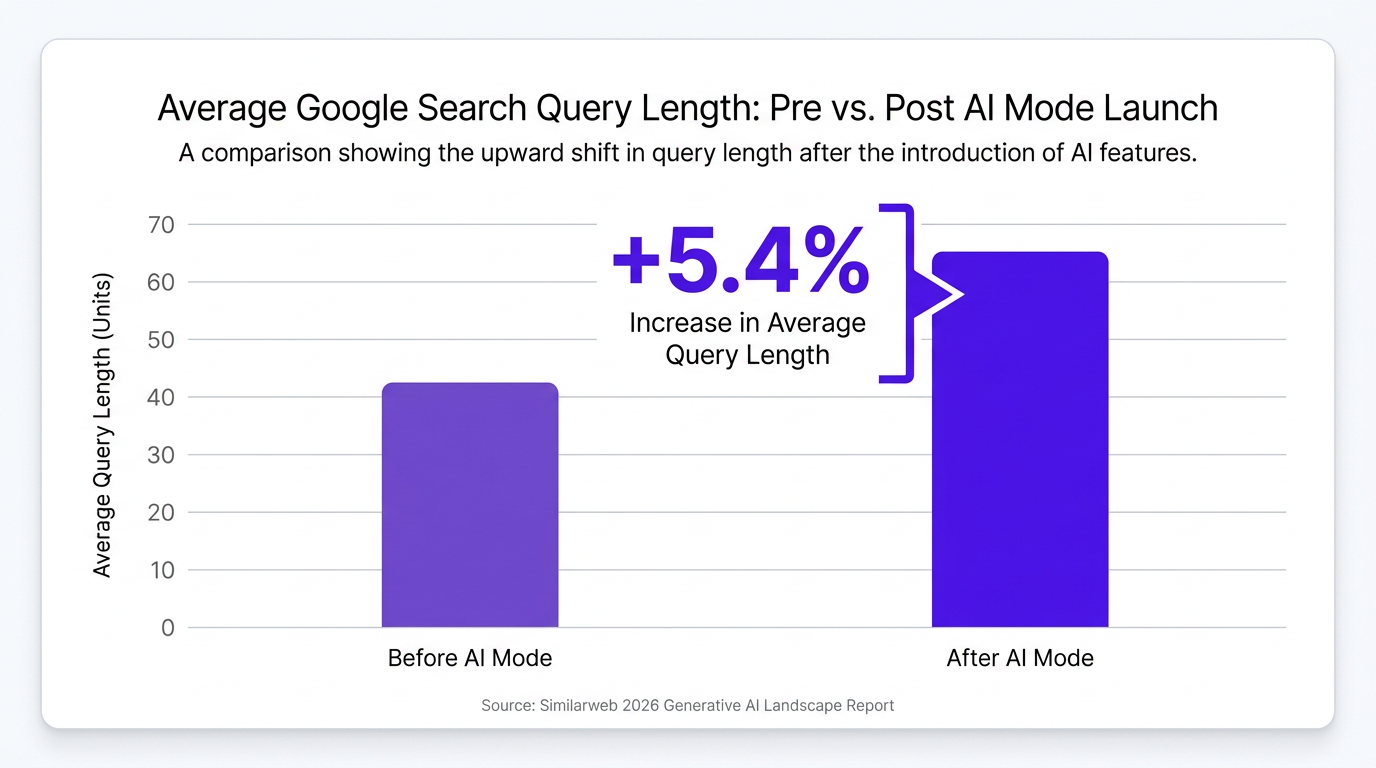
Similarweb's 2026 dataset shows Google search query length up 5.4% since Google's AI Mode launched. Google reported in October 2025 that people were asking questions in AI Mode that were nearly three times longer than traditional searches. That is not noise. It is evidence that users are rewriting how they express intent. One interpretation is that Google is training users to ask for more, a behavior that could reshape SERPs well beyond AI Mode itself.
Longer queries read less like keywords and more like briefs: conversational, constraint-heavy, and packed with context. Someone who once typed "project management software" can now ask "what project management tool works best for a remote team of ten that already uses Slack and needs budget tracking." The structure changes, the competitive set changes, and the content that satisfies the ask changes with it. If your keyword research is still anchored to short-tail categories, it will miss a growing share of the questions your audience is already forming.
This is why the ai overview statistics argument is often a distraction in day-to-day planning. Whether the blended US number is 40% or 20% matters less than whether your pages can answer the longer, more specific prompts people are now using. Prompt research for AI search is one way to surface those emerging questions early, before they harden into a competitive cluster.
Info: AI Overview prevalence can vary materially by niche, device, geography, query length, and intent. Industry-wide averages therefore should not be treated as a substitute for measuring the queries that matter to your brand.
Stop Adopting Averages. Measure Your Own Surface Area.
Using an industry-average trigger rate as a forecasting input is a category mistake. The number that matters is the rate across your own keyword set, not a blended view of all US searches. Depending on vertical and intent mix, your exposure may differ materially from the industry average. Treating 40% as a stand-in will produce models that are wrong in both directions: some teams will underreact, others will overcorrect.
The fix is operational, not philosophical: measure your trigger rate on your keyword universe. Vizup's AI Mode tracking workflow built for this will run your list against live SERPs and report how often AI Overviews appear for your niche. Vizup's Answer Engine Monitoring is designed for that workflow, tracking which target queries trigger AI Overviews and whether your brand shows up inside them. That is the figure you can actually defend in a budget conversation.
Vizup goes beyond monitoring to act as an Organic Autopilot for modern discovery. It helps brands monitor, create, optimise, publish, and learn across Search, Social, Communities, AI Answer Engines, and Local Discovery through AI agents, human experts, and live SEO, pSEO, AEO, and GEO tools. Paid ads remain available as an optional amplification add-on.
If you are building a broader measurement stack, AI search performance analytics lays out how to move past trigger rates into metrics that tie AI search exposure to outcomes. When clicks drop because an AI Overview satisfies the query on the results page, content marketing metrics that matter when AI answers reduce clicks sketches what to watch instead.
Key Takeaways for Your 2026 SEO and Marketing Strategy
What the trigger rate debate actually means for planning:
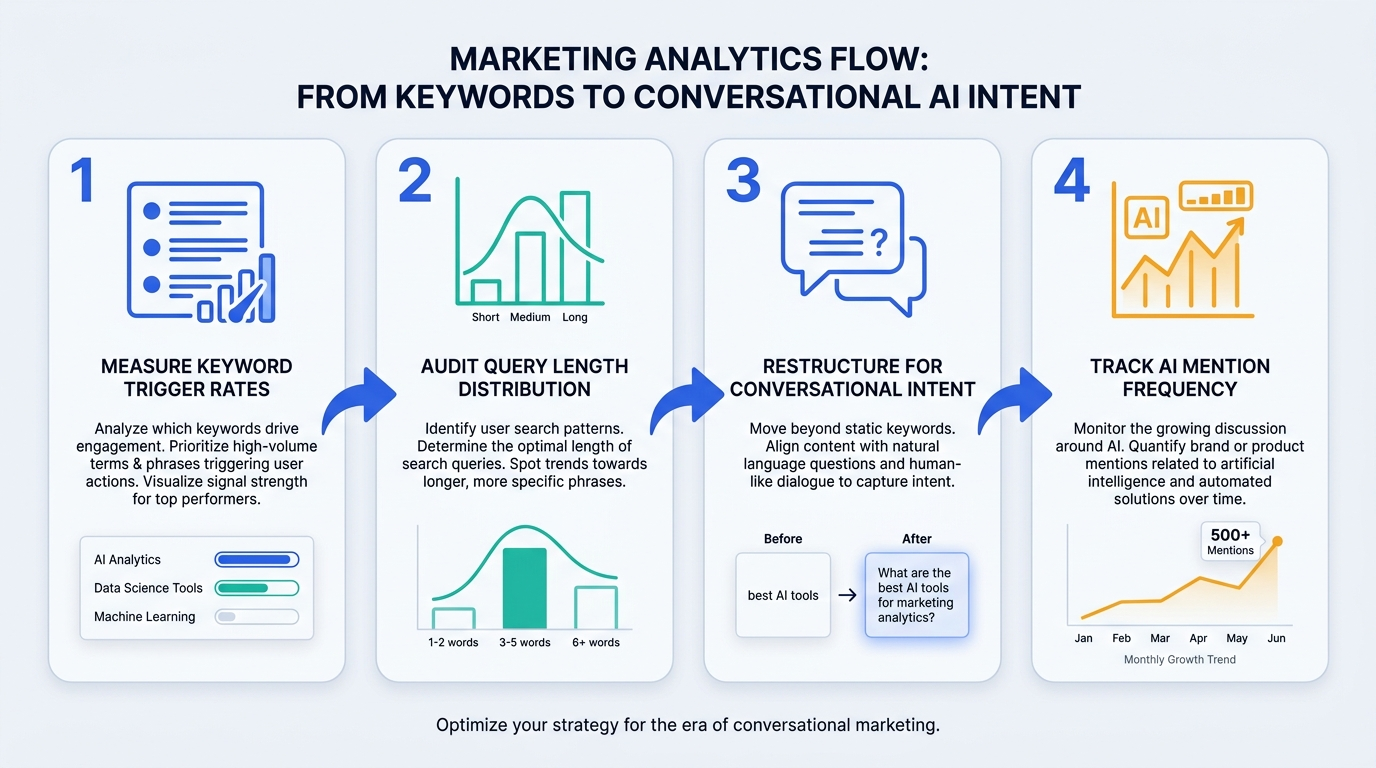
- Treat the 40% figure as a directional signal, not a planning input. Similarweb's finding from the generative AI report is useful as evidence that AI Overviews are widespread, but your real exposure is a function of your keyword mix. Semrush's lower numbers are not a rebuttal; they are a different sample answering a different question.
- Recalibrate keyword research for longer queries. The 5.4% increase in Google search query length points to a structural shift. Short-tail strategies miss the context-rich, multi-part questions AI Mode encourages. Put more weight on question-led content that resolves specific, compound intent.
- Measure your own trigger rate before forecasting. Run your actual keyword set against live SERPs with dedicated monitoring. That is the only trigger-rate number that belongs in a traffic model or budget deck.
- Shift visibility metrics toward AI mentions. Similarweb reports an association between AI mentions and a 2.5-times higher likelihood of a subsequent site visit within its dataset. Presence inside AI Overviews is becoming its own channel of visibility, and it does not show up cleanly in traditional rank tracking.
- Clicks are not the only outcome worth measuring. When AI Overviews absorb direct answers, consideration and brand recall take on more weight. Build measurement that captures both, and treat improving brand visibility in AI search as a strategic workstream, not an afterthought.
Frequently Asked Questions
What is a good AI Overviews trigger rate?
There is no single "good" number. AI Overview prevalence depends on factors such as vertical, intent mix, query length, geography, and device. The only benchmark that holds up is your own rate, tracked consistently over time.
How can I find my website's AI Overview trigger rate?
You need to test your specific keyword set against live Google SERPs and log when an AI Overview appears. Vendor-wide averages from the Similarweb generative AI report (or anyone else) are not a substitute for that measurement. Vizup's Answer Engine Monitoring tracks trigger rates at the keyword level so you can plan off brand-specific data. For tool options, see Vizup's AI Mode tracking software review.
Will AI Overviews replace traditional SEO?
Not replace, but it will change the shape of the work. AI Overviews can absorb clicks on certain query classes; one 2025 study found users click a traditional organic result only 8% of the time when an AI Overview is present, versus 15% when it is absent. The response is not to drop SEO, but to optimize for AI citation alongside rankings and to treat brand mentions inside AI answers as a distinct visibility metric.
Do AI Overviews show for every search?
No. They show up far more often on informational, question-based, and research queries than on navigational or transactional ones. Branded searches, product-specific queries, and local searches frequently return more traditional SERPs. Your percentage of searches with AI Overviews will mostly reflect how your keyword set breaks down by intent.
How does the AI Overviews trigger rate in 2026 compare to 2025?
BrightEdge reported AI Overviews on about 48% of US queries in early 2026, a 58% increase in presence versus the prior year. Similarweb's 40%-plus estimate supports the same direction of travel. The trend line is up, driven by continued expansion of AI Mode and users shifting their ai mode search behaviour toward longer, more complex queries.
